Understanding Tellius charts
Quick guide to all chart types in Tellius—learn when to use each visualization, from bar and line charts to KPIs, maps, funnels, and more.
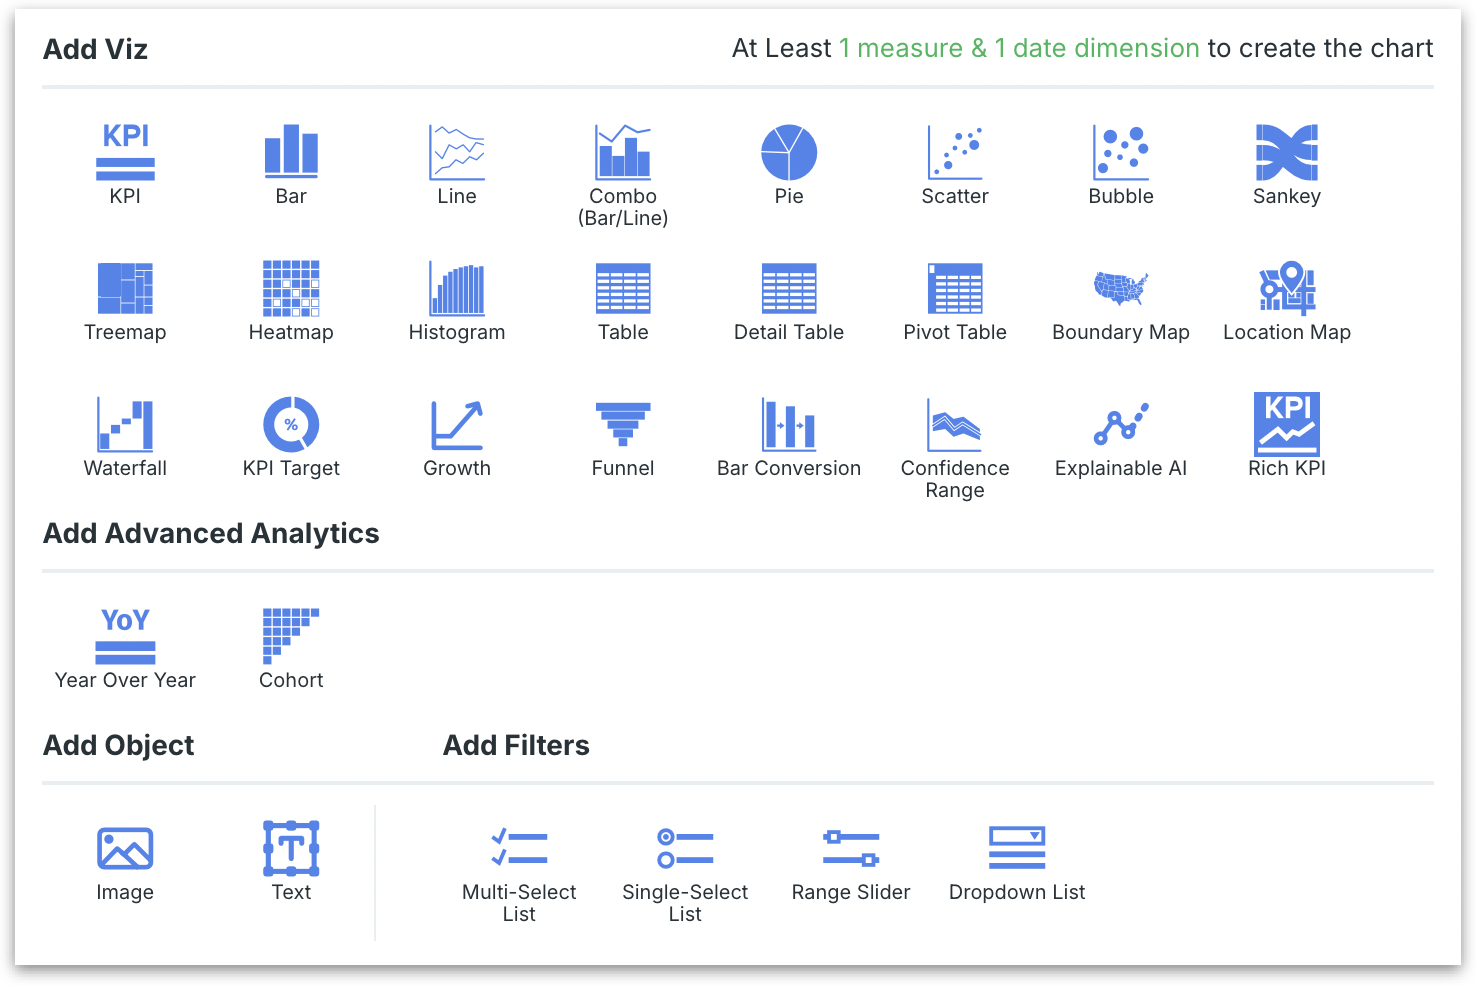
To help you make the most of this feature, let's dive into a quick overview of each chart type used in Tellius. Whether you’re tracking trends with a line chart, comparing categories with a bar graph, or uncovering relationships with a scatter plot, each chart type brings its unique strengths to the table.

Bar Chart
Relevant for comparison queries. Bar charts are excellent for visualizing differences between groups or categories.
Example: “Show profit by department”
Line Chart
Ideal for analyzing changes and trends over time. It connects individual data points, making it easy to track rises and falls in data over intervals.
Example: "Show monthly revenue trend for the past year"
Scatter Plot
Useful for analyzing the relationship between variables, showing how one variable is affected by another.
Example:
KPI (Key Performance Indicator)
Relevant for tracking progress against goals. KPIs are straightforward and focus on critical data points.
Example: “Show me gross profit margin for this quarter”
Combo (Bar and Line)
Combines the clarity of bar charts with the trend-tracking ability of line charts. This chart allows for dual insights in a single view.
Example: “Show me monthly sales and profit for last year”
Pie Chart
Effective for showing proportions and compositions. It visually represents parts of a whole data.
Example: “Show me percentage of employees by department”
Table
Relevant for queries needing detail and precision. Tables are ideal when every data point matters.
Example: “List all IT projects with their budget, status, and team size”
Detail Table
Similar to a regular table but provides more granular details. It's helpful when comprehensive data representation is needed.
Example: “Sales report including customer, market, region, quantity, and country”
Pivot Table
Best for summarization and categorization. It allows for quick reorganization and grouping of data.
Example: “Summary of monthly sales by region and category”
Tables vs Detailed tables vs Pivot tables
Regular tables are straightforward and precise for listing detailed information.
Detailed tables offer a deeper level of granularity, making them ideal for complex datasets.
Pivot tables are best for summarizing and categorizing data, allowing quick reorganization and grouping.
Histogram
Useful for data distribution. It groups data into ranges, showing the frequency of values within these ranges.
Example: “Frequency distribution of daily sales last month”
Heatmap
Useful for visualizing complex data sets. Heatmaps use color intensity to convey data density, making it easy to spot high and low points.
Example: “Show me employee performance ratings by department and experience level”
Treemap
Treemap chart provides elaborate, area-based visualization for hierarchical or nested data. The large rectangles (representing tree branches) and the small rectangles (representing each node in that branch) are sized by the measure values. Treemap allows you to plot hundreds of data points that can help with quick comparisons.
Example: “Show me revenue by product categories and subcategories”
Sankey Diagram
Effective for showing flows and transfers between different stages or categories. It highlights the magnitude of these movements.
Example: “Show me customer journey from initial channels to final purchase for the last six months”
Bubble Chart
Relevant for multi-variable queries. Bubble charts can display three dimensions of data. It adds a size dimension to the traditional scatter plot, offering more context.
Example: “Compare companies by revenue, market share, and profit margin”
Boundary Map
Suitable for geographic boundary visualization. It's used for plotting data over specific geographic areas.
Example: “Geographical distribution of all company branches”
Location Map
Location maps provide geographical context to data. Ideal for displaying data points geographically. It helps in understanding spatial patterns or distributions.
Example: “Location of all customers in India”
Boundary maps vs Location maps
Boundary maps are used to outline and highlight areas or regions, such as countries, states, districts, or sales territories, emphasizing their geographic limits and extents. In contrast, location maps primarily focus on displaying specific points or locations geographically, often used to pinpoint places like store locations, customer addresses, or regional offices.
Waterfall Chart
Ideal for showing step-by-step changes. They help in understanding how each positive or negative value affects the total value over a sequence of steps.
Example: “Show me the breakdown of last year's profit, starting from total revenue and subtracting each expense sequentially”
KPI Target
Highlights performance against a predefined target. It's used for goal tracking and performance measurement.
Example: “Comparing actual sales against sales targets”
KPI charts vs KPI target charts
KPI charts focus on visualizing key performance indicators, displaying current values of crucial metrics like sales figures, customer satisfaction, or production volumes. KPI Target charts, on the other hand, not only show the current value of a KPI but also compare it against a predefined target or goal, highlighting how the current performance measures up to the set objectives.
Confidence Range
Useful for representing uncertainty in data. It shows potential variability and is often used in predictive models/queries.
Example: “Projected sales growth for the next quarter with confidence intervals”
Bar Conversion
Ideal for showing conversion rates or stages in a process. It helps in understanding progression through different stages.
Example: “Analyzing conversion rates at different stages of a sales funnel”
Funnel Chart
Funnel charts are great for depicting stages in a process. Displays the reduction in data through different stages. It’s often used in sales and marketing to track the stages of the customer journey.
Example: “Show me customer journey from awareness to purchase for productAB”
Bar conversion charts vs Funnel charts
Bar conversion charts are used to display conversion rates at different stages of a process, effectively showing how a value or quantity changes from one stage to the next. In contrast, funnel charts are specifically designed to represent the stages in a sales or marketing funnel, visually depicting the reduction in numbers as potential leads or customers progress through each stage towards a final action or sale.
Growth Chart
Growth charts clearly show upward or downward trends, tracking increases or decreases over time. It's suitable for representing growth metrics.
Example:
Year over Year (YoY) Chart
A YoY (Year over Year) chart compares metrics from one period to the same period in previous years to illustrate trends or changes over time.
Example: “Show me sales of June this year vs June last year”
Cohort Charts
A cohort chart tracks and compares the behavior or performance of groups of users (cohorts) who share a common characteristic or experience within a defined time frame.
Example: “Show me retention rates of employees hired in different years”
YoY charts vs Cohort charts
Year over Year (YoY) charts are used to compare data metrics across the same periods in consecutive years, highlighting trends and changes over time, such as annual growth or decline. Cohort charts, however, group users or items into cohorts based on shared characteristics or experiences during a specific period, and track their behavior or performance over time, revealing patterns within each cohort group.
Rich KPI Chart
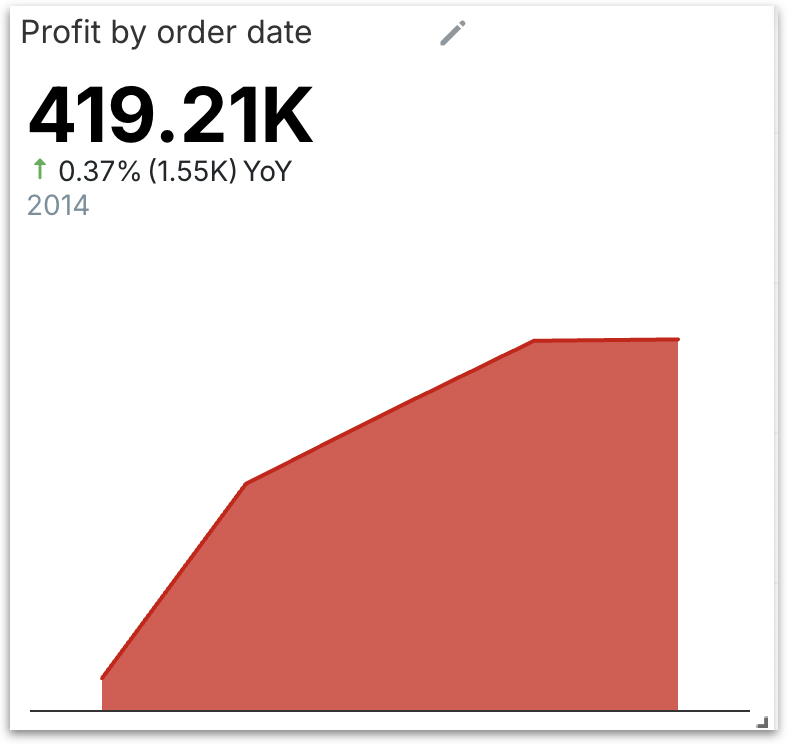
The Rich KPI chart is a powerful, compact visualization designed to track the trend of KPI metric over time using a mini area chart (sparkline). Given a measure and a date dimension, it highlights period-over-period change (YoY, MoM, etc.) using color-coded deltas.
Example: Highlight sales by month per region or category and compare YoY or MoM changes

Was this helpful?