Tellius
  • 🚩Getting Started
    • 👋Say Hello to Tellius
      • Glossary
      • Tellius 101
      • Navigating around Tellius
    • ⚡Quick Start Guides
      • Search
      • Vizpads (Explore)
      • Insights (Discover)
    • ✅Best Practices
      • Search
      • Vizpads (Explore)
      • Insights (Discover)
      • Predict
      • Data
    • ⬇️Initial Setup
      • Tellius architecture
      • System requirements
      • Installation steps for Tellius
      • Customizing Tellius
    • Universal Search
    • 🏠Tellius Home Page
  • Kaiya
    • ♟️Understanding AI Agents & Agentic Flows
      • Glossary
      • Composer
      • 🗝️Triggering an agentic workflow
      • The art of possible
      • Setting up LLM for Kaiya
    • 🤹Kaiya conversational AI
      • ❓FAQs on Kaiya Conversations
      • Triggering Insights with "Why" questions
      • Mastering Kaiya conversational AI
      • 📒Kaiya Learnings
      • Kaiya Terms of Service
  • 🔍Search
    • 👋Get familiar with our Search interface
    • 🤔Understanding Tellius Search
    • 📍Search Guide
    • 🚀Executing a search query
      • Selecting a Business View
      • Typing a search query
      • Constructing effective search queries
      • Marketshare queries
    • 🔑Analyzing search results
      • Understanding search results
      • Search Inspector
      • Time taken to execute a query
      • Interacting with the resulting chart
    • 📊Know your charts in Tellius
      • Understanding Tellius charts
      • Variations of a chart type
      • Building charts from Configuration pane
      • List of chart-specific fields
      • Adding columns to fields in Configuration pane
      • Absolute and percentage change aggregations
      • Requirements of charts
      • Switching to another chart
      • Formatting charts
      • Advanced Analytics
      • Cumulative line chart
    • 🧑‍🏫Help Tellius learn
    • 🕵️‍♂️Search history
    • 🎙️Voice-driven search
    • 🔴Live Query mode
  • 📈Vizpads (Explore)
    • 🙋Meet Vizpads!
    • 👋Get familiar with our Vizpads
    • #️⃣Measures, dimensions, date columns
    • ✨Creating Vizpads
    • 🌐Applying global filters
      • Filters in multi-BV Vizpads
      • Filters using common columns
    • 📌Applying local filters
    • 📅Date picker in filters
      • Customizing the calendar view
    • ✅Control filters
      • Multi-select list
      • Single-select list
      • Range slider
      • Dropdown list
    • 👁️Actions in View mode
      • Interacting with the charts
    • 📝Actions in Edit mode
      • 🗨️Viz-level actions
    • 🔧Anomaly management for line charts
      • Instance level
      • Vizpad level
      • Chart level
    • ⏳Time taken to load a chart
      • Instance level
      • Vizpad level
      • Chart level
    • ♟️Working with sample datasets
    • 🔁Swapping Business View of charts
      • Swapping only the current Vizpad
      • Swapping multiple objects
      • Configuring the time of swap
    • 🤖Explainable AI charts
  • 💡Insights (Discover)
    • 👋Get familiar with our Insights
    • ❓Understanding the types of Insights
    • 🕵️‍♂️Discovery Insights
    • ➕How to create new Insights
      • 🔛Creating Discovery Insight
      • 🔑Creating Key Driver Insights
      • 〰️Creating Trend Insights
      • 👯Creating Comparison Insights
    • 🧮The art of selecting columns for Insights
      • ➡️How to include/exclude columns?
  • 🔢Data
    • 👋Get familiar with our Data module
    • 🥂Connect
    • 🪹Create new datasource
      • Connecting to Oracle database
      • Connecting to MySQL database
      • Connecting to MS SQL database
      • Connecting to Postgres SQL database
      • Connecting to Teradata
      • Connecting to Redshift
      • Connecting to Hive
      • Connecting to Azure Blob Storage
      • Connecting to Spark SQL
      • Connecting to generic JDBC
      • Connecting to Salesforce
      • Connecting to Google cloud SQL
        • Connecting to a PostgreSQL cloud SQL instance
        • Connecting to an MSSQL cloud SQL instance
        • Connecting to a MySQL Cloud SQL Instance
      • Connecting to Amazon S3
      • Connecting to Google BigQuery
        • Steps to connect to a Google BigQuery database
      • Connecting to Snowflake
        • OAuth support for Snowflake
        • Integrating Snowflake with Azure AD via OAuth
        • Integrating Snowflake with Okta via OAuth
        • Azure PrivateLink
        • AWS PrivateLink
        • Best practices
      • Connecting to Databricks
      • Connecting to Databricks Delta Lake
      • Connecting to an AlloyDB Cluster
      • Connecting to HDFS
      • Connecting to Looker SQL Interface
      • Loading Excel sheets
      • 🚧Understanding partitioning your data
    • ⏳Time-to-Live (TTL) and Caching
    • 🌷Refreshing a datasource
    • 🪺Managing your datasets
      • Swapping datasources
    • 🐣Preparing your datasets
      • 🤾Actions that can be done on a dataset
      • Data Pipeline
      • SQL code snippets
      • ✍️Writeback window
      • 🧩Editing Prepare → Data
      • Handling null or mismatched values
      • Metadata view
      • List of icons and their actions
        • Functions
        • SQL Transform
        • Python Transform
        • Standard Aggregation
        • Creating Hierarchies
      • Dataset Scripting
      • Fusioning your datasets
      • Scheduling refresh for datasets
    • 🐥Preparing your Business Views
      • 🌟Create a new Business View
      • Creating calculated columns
      • Creating dynamic parameters
      • Scheduling refresh for Business Views
      • Setting up custom calendars
    • Tellius Engine: Comparison of In-Memory vs. Live Mode
    • User roles and permissions
  • Feed
    • 📩What is a Feed in Tellius?
    • ❗Alerts on the detection of anomalies
    • 📥Viewing and deleting metrics
    • 🖲️Track a new metric
  • Assistant
    • 💁Introducing Tellius Assistant
    • 🎤Voice-based Assistant
    • 💬Interacting with Assistant
    • ↖️Selecting Business View
  • Embedding Tellius
    • What you should know before embedding
    • Embedding URL
      • 📊Embedding Vizpads
        • Apply and delete filters
        • Vizpad-related actionTypes
        • Edit, save, and share a Vizpad
        • Keep, remove, drill sections
        • Adding a Viz to a Vizpad
        • Row-level policy filters
      • 💡Embedding Insights
        • Creating and Viewing Insights
      • 🔎Embedding Search
        • Search query execution
      • Embedding Assistant
      • 🪄Embedding Kaiya
      • Embedding Feed
  • API
    • Insights APIs
    • Search APIs
    • Authentication API (Login API)
  • ✨What's New
    • Release 5.4
      • Patch 5.4.0.x
    • Release 5.3
      • Patch 5.3.1
      • Patch 5.3.2
      • Patch 5.3.3
    • Release 5.2
      • Patch 5.2.1
      • Patch 5.2.2
    • Release 5.1
      • Patch 5.1.1
      • Patch 5.1.2
      • Patch 5.1.3
    • Release 5.0
      • Patch 5.0.1
      • Patch 5.0.2
      • Patch 5.0.3
      • Patch 5.0.4
      • Patch 5.0.5
    • Release 4.3 (Fall 2023)
      • Patch 4.3.1
      • Patch 4.3.2
      • Patch 4.3.3
      • Patch 4.3.4
    • Release 4.2
      • Patch 4.2.1
      • Patch 4.2.2
      • Patch 4.2.3
      • Patch 4.2.4
      • Patch 4.2.5
      • Patch 4.2.6
      • Patch 4.2.7
    • Release 4.1
      • Patch 4.1.1
      • Patch 4.1.2
      • Patch 4.1.3
      • Patch 4.1.4
      • Patch 4.1.5
    • Release 4.0
Powered by GitBook

© 2025 Tellius

On this page
  • 💊 Pharma & Life Sciences
  • 💰 Finance & FP&A
  • 🛒 Retail & CPG
  • 💼 Sales
  • 🚚 Operations & Supply Chain
  • 🏦 Banking & Insurance
  • 🌐 E-commerce & Digital Business
  • 🧑‍🤝‍🧑 HR & People Analytics

Was this helpful?

Export as PDF
  1. Kaiya
  2. Understanding AI Agents & Agentic Flows

The art of possible

Real-world applications of our AI agents and agentic workflows

PreviousTriggering an agentic workflowNextSetting up LLM for Kaiya

Last updated 23 days ago

Was this helpful?

Agentic flows are intelligent, modular analytics processes composed of AI Agents that understand your questions and deliver insights without writing a single line of code.

The Steps section in Composer lets you describe any workflow like the ones below in natural language. Our AI agents will do the rest: gather the relevant data, run the analysis, generate visuals, and surface insights.
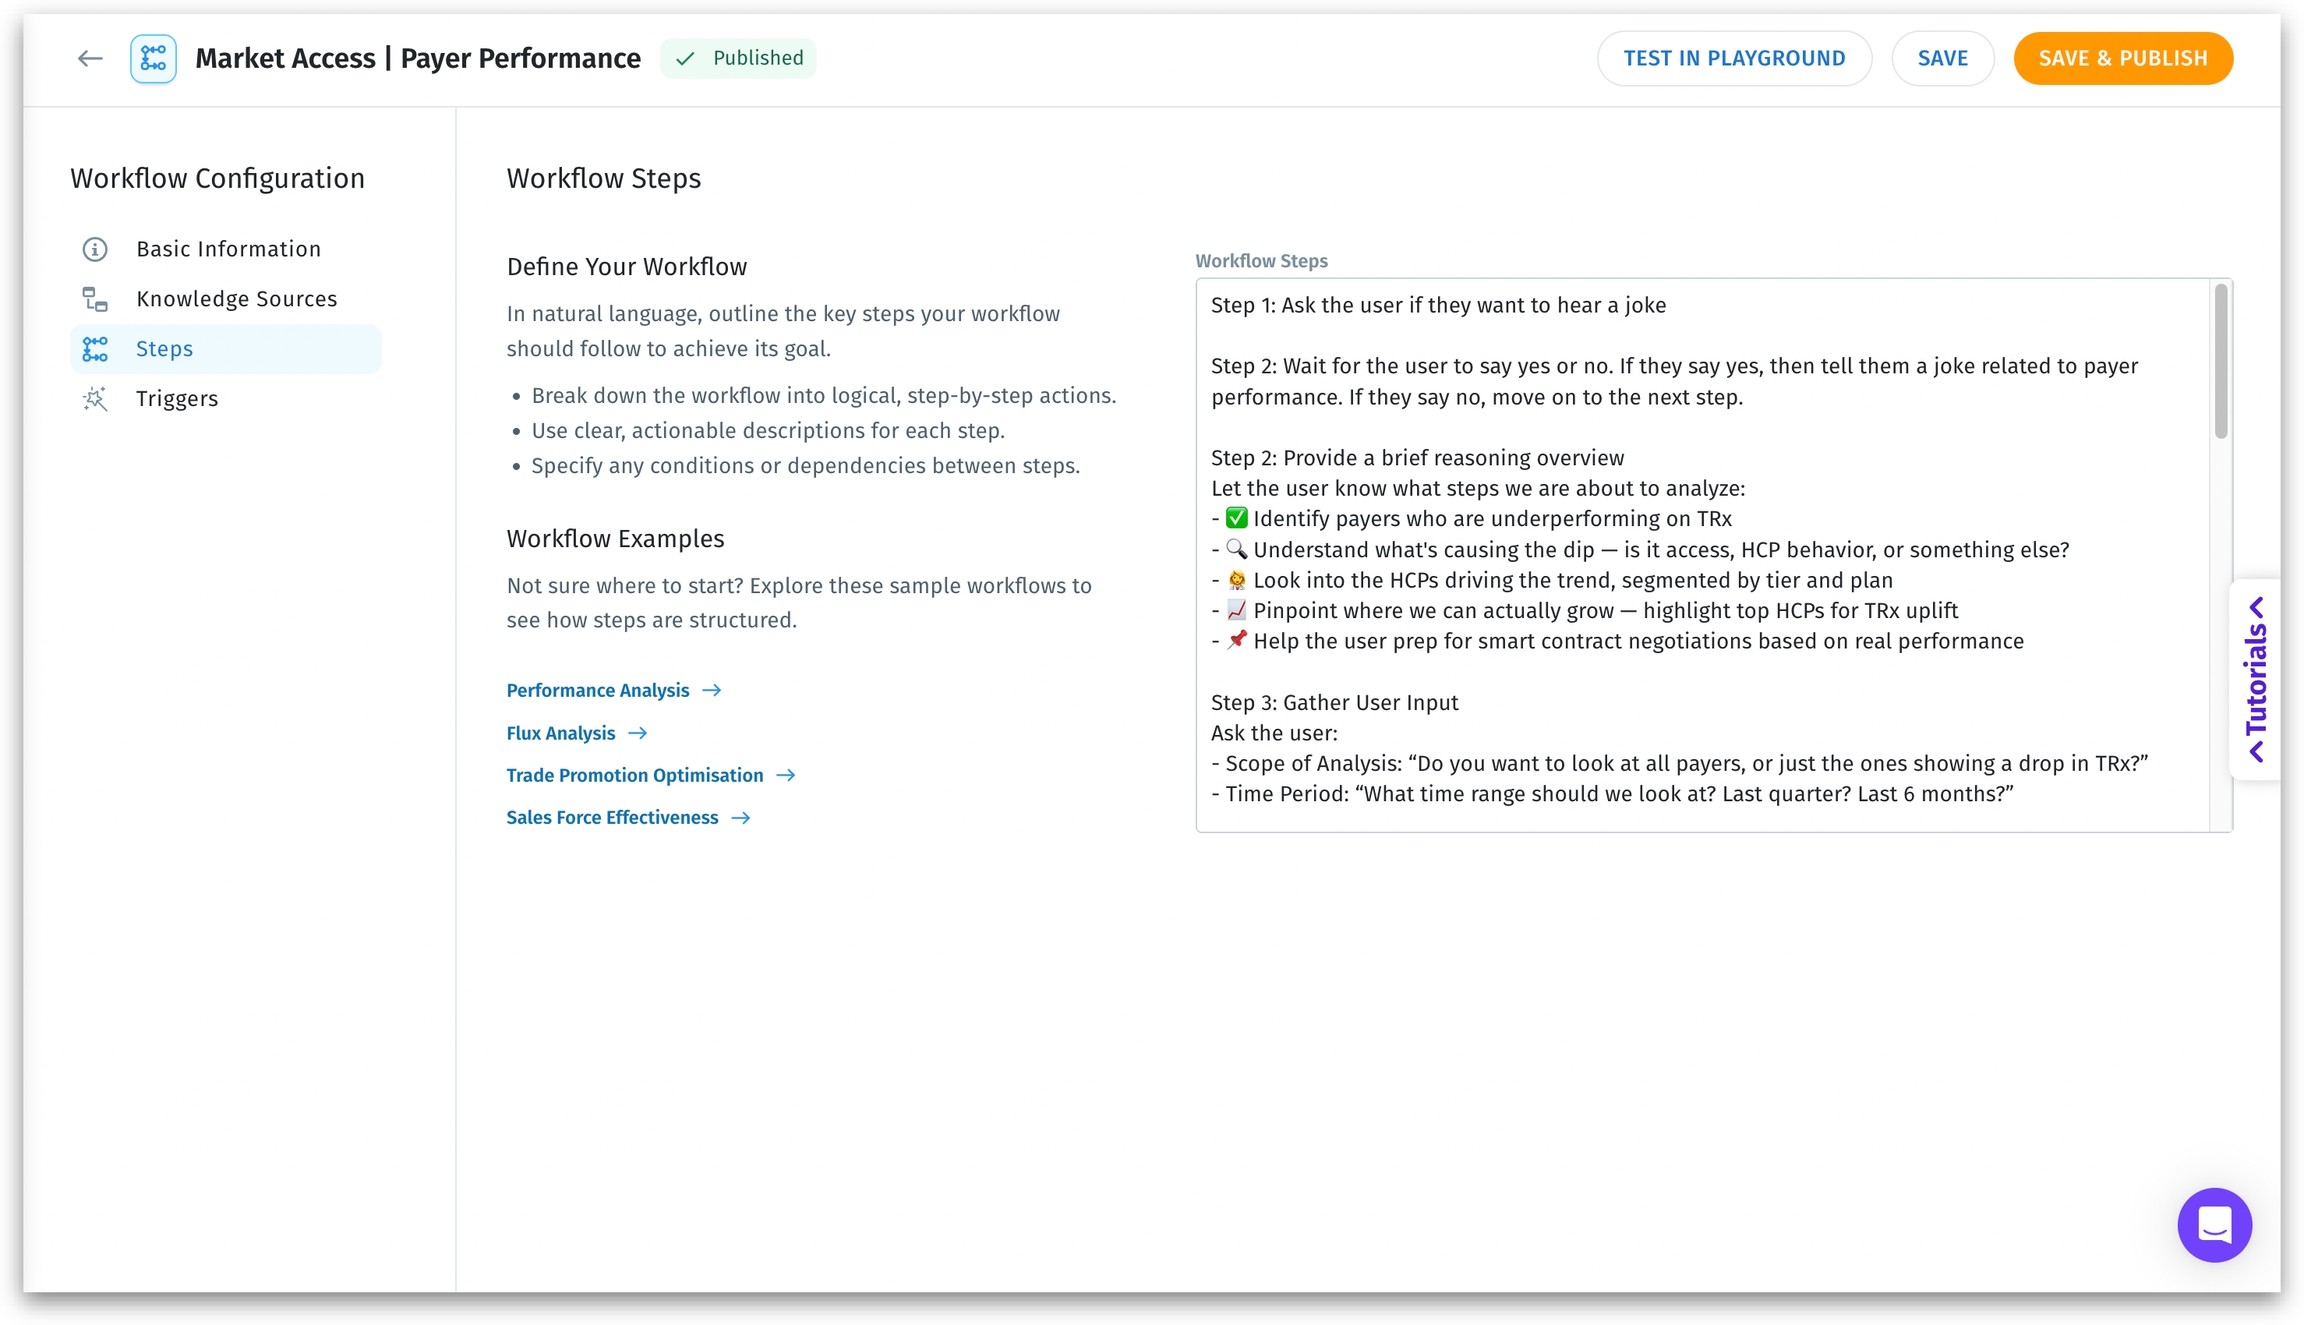
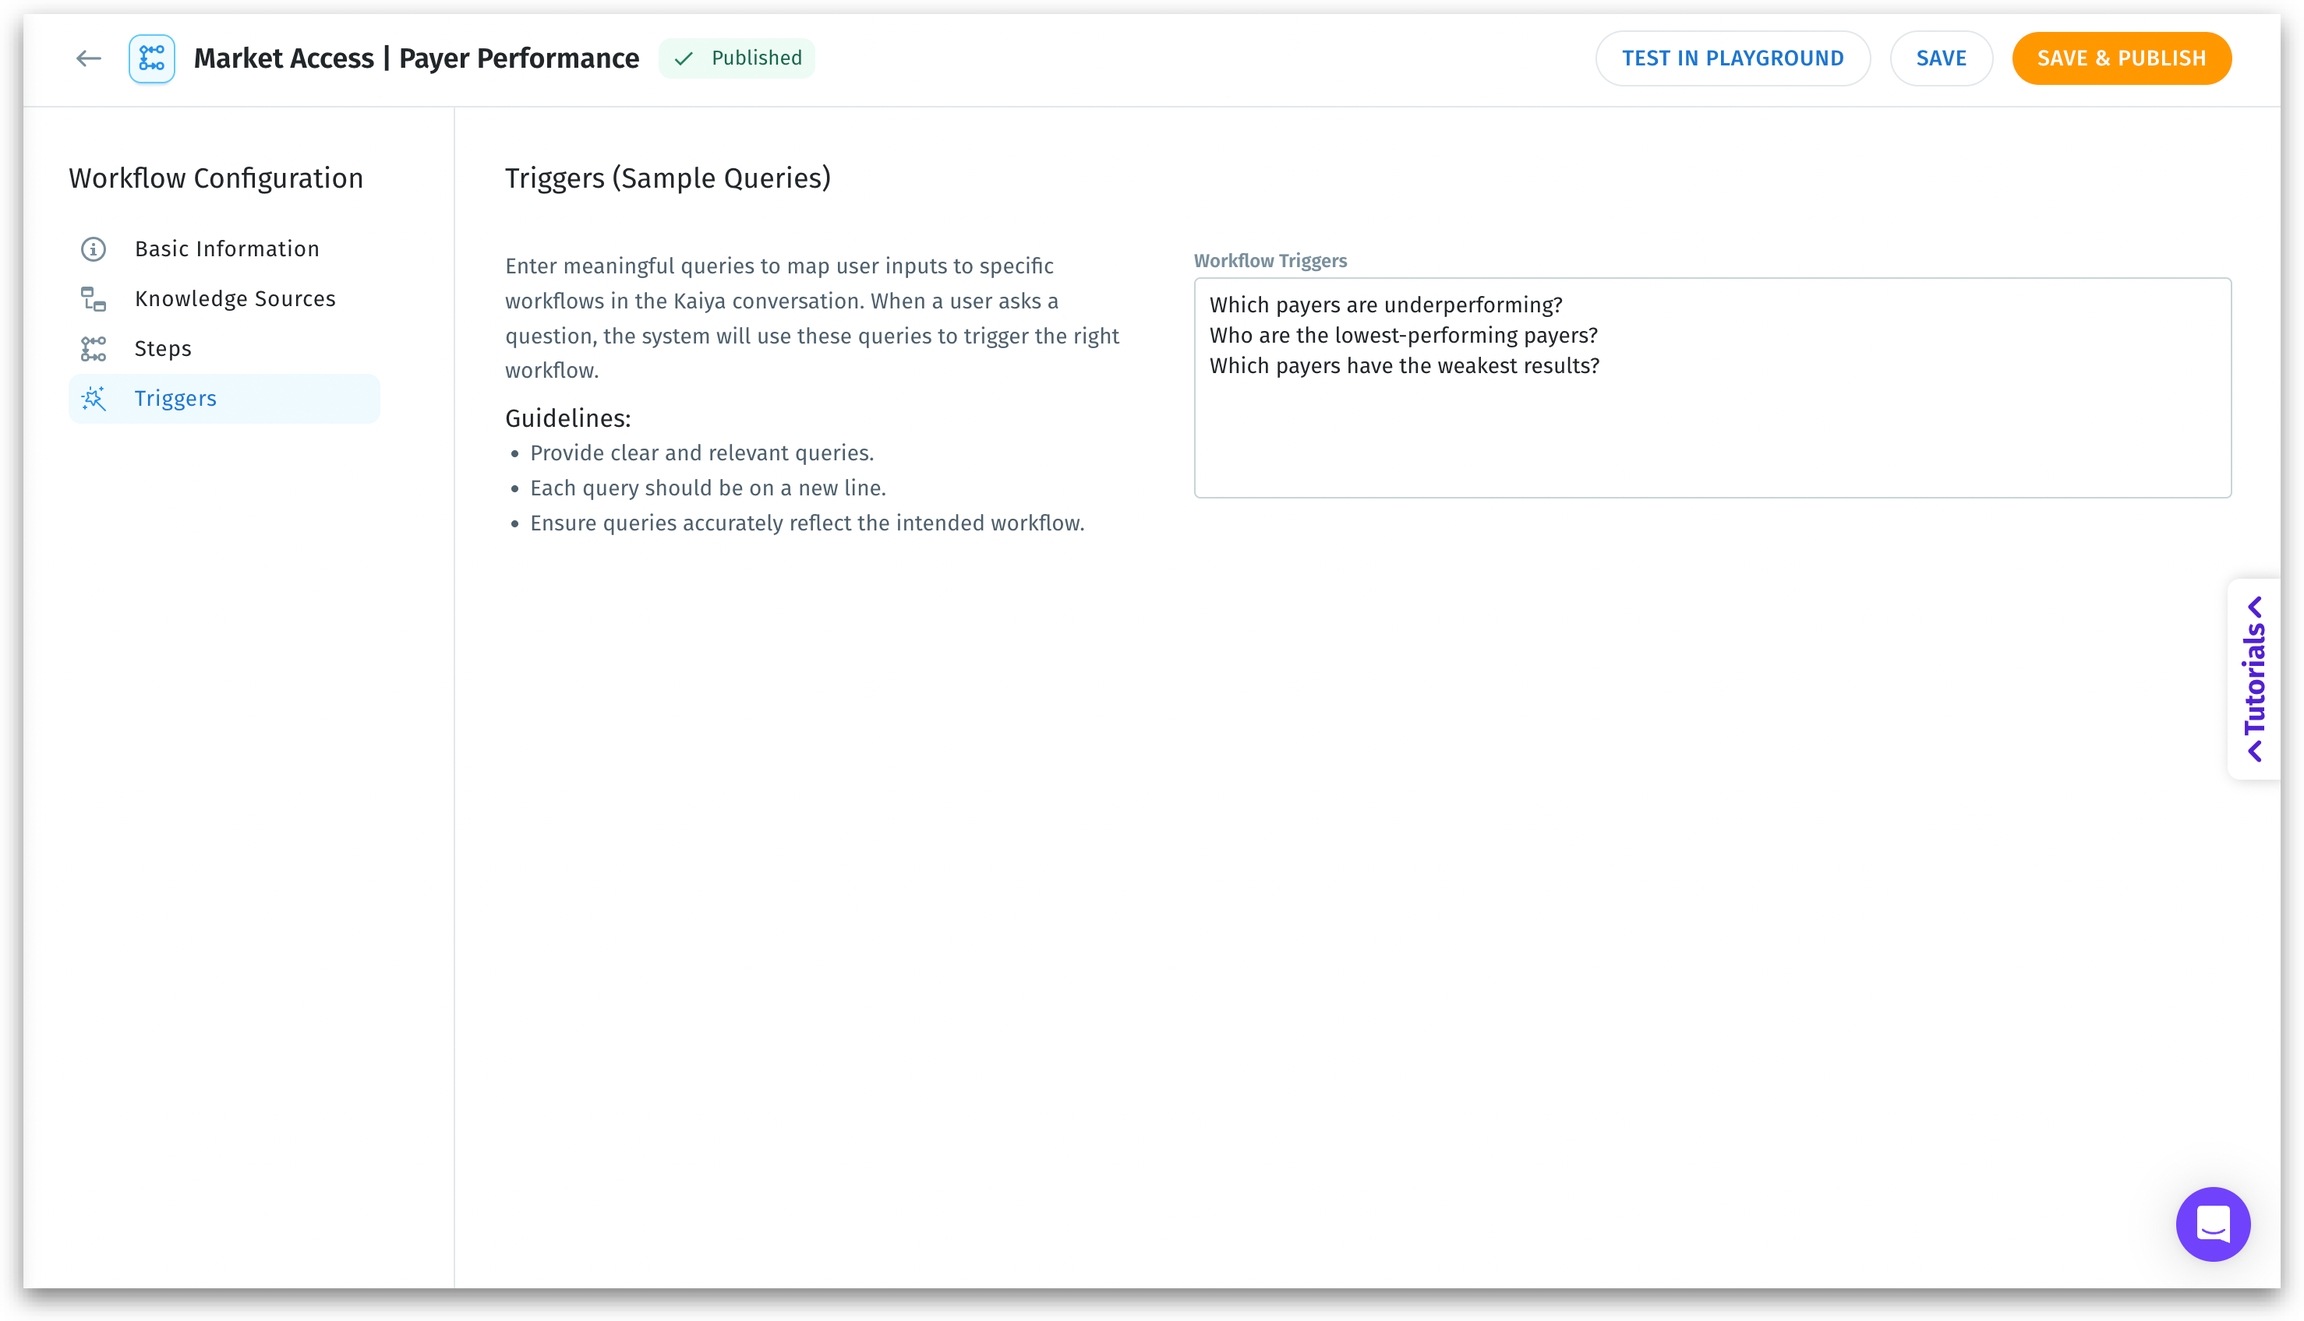
Each workflow becomes a living, reusable intelligence asset in your Agent Library, ready to trigger when you (or anyone in your team) asks the right question (as mentioned in the Triggers section).
Below are real, industry-relevant examples showing what you can build—organized by use case domain.

💊 Pharma & Life Sciences

Which payer plans are underperforming on TRx and why?

Analyze payer plans underperforming on TRx, segment by access restrictions or HCP tiers, and suggest data-backed contract renegotiation points.

Why is our new product launch lagging in key territories?

Identify territories or HCPs (Health Care Professionals) where a new launch is lagging, then break down messaging gaps, rep engagement, or access barriers.

What’s driving the recent drop in market share for Brand X?

Investigate market share erosion by segment, uncover if it's driven by new competitors, loss of exclusivity, or formulary exclusion.

Why is a high sampling rate not translating to scripts?

Analyze sampling and TRx data together to pinpoint why high sample volume isn't translating into prescriptions, by HCP or specialty.

💰 Finance & FP&A

What’s causing the variance between actuals and forecast this quarter?

Automatically compute and visualize variances by department or cost center and identify drivers like overspend in labor or marketing.

Which teams or vendors are causing invoice delays?

Track invoice approval SLAs, highlight vendors or departments causing delays, and suggest automation or escalation points.

Why are our margins shrinking despite stable revenue?

Break down decreasing margins by region or SKU and isolate root causes like price cuts, cost increases, or channel mix shifts.

🛒 Retail & CPG

Which products should we discontinue to boost margin and reduce clutter?

Identify underperforming SKUs with low margin and high cannibalization impact, and generate a shortlist for discontinuation.

Did our last trade promotion actually drive incremental sales?

Measure uplift from trade promotions by channel or retailer and highlight where discounting didn’t drive incremental sales.

Why are we consistently facing out-of-stock issues for Product Y?

Track and explain frequent stockouts at a product or store level, connecting issues to supplier lead times or DC inefficiencies.

💼 Sales

Which reps are underperforming in high-potential territories?

Match rep performance to territory opportunity, flag underperformers in high-potential areas, and suggest redeployment.

Where are deals stalling in the pipeline and why?

Identify pipeline leaks by stage, region, or deal owner and determine whether the issue is conversion, qualification, or velocity.

Why did Region A miss their sales target this quarter?

Analyze why certain reps or teams missed quota—whether due to low volume, high-value deal loss, or lack of activity.

🚚 Operations & Supply Chain

Which warehouses or carriers are failing our delivery SLAs?

Track late deliveries, segment by carrier or warehouse, and surface which combinations are failing SLA the most often.

Where do we have excess inventory building up?

Identify aging or excess inventory by category, link to misaligned demand forecasts, and quantify holding costs.

Why are our supplier lead times increasing?

Highlight vendors with increasing lead times, compare to historical norms, and recommend vendor evaluation or escalation.

🏦 Banking & Insurance

What’s slowing down our claims approval process?

Diagnose delays in claims processing by team or system bottlenecks (manual review, missing info etc.), and suggest routing or staffing optimizations.

Which customer segments are showing high churn risk?

Use attrition analytics to flag customer segments with high churn risk, identify shared behaviors, and suggest outreach.

What’s behind the spike in fraudulent transactions this week?

Break down recent fraud spike by transaction type, location, and device to find patterns and recommend rules.

🌐 E-commerce & Digital Business

Why are customers abandoning carts before checkout?

Analyze drop-offs by device, page load times, and payment method to pinpoint why customers abandon checkout.

Why are return rates spiking for certain products?

Break down return reasons by product, geography, or channel to find quality or sizing issues affecting profitability.

Why did our latest email campaign underperform?

Understand why open or click rates dropped—by send time, device, campaign type—and test alternatives.

🧑‍🤝‍🧑 HR & People Analytics

Why are employees leaving our company in higher numbers?

Segment leavers by department, tenure, and performance score to uncover common causes behind churn.

Where are we losing candidates in the recruitment funnel?

Track where candidates drop off in the hiring process and determine whether it's role fit, offer rejection, or slow feedback.

Why are overtime costs rising in certain departments?

Identify teams or locations where overtime is growing unsustainably, and highlight workload or staffing issues.

♟️
Steps section in Composer
Triggers section in Composer