Creating Hierarchies
Create well-structured hierarchies for easy drill-down
Last updated
Was this helpful?
Create well-structured hierarchies for easy drill-down
Last updated
Was this helpful?
Hierarchies allow you to structure your data in a multi-level format, enabling you to drill down into details in a step-by-step manner. For example, a hierarchy such as Country โ State โ City
provides an intuitive way to analyze data across geographical levels. By using hierarchies, you can:
Quickly navigate from summary-level data to granular details.
Organize dimensions in logical sequences for better insights.
Explore summary-level metrics (e.g., total sales by country) and drill down into details (e.g., sales by city).
Under Data โ Prepare โ Data, select the required dataset and click on Edit.
Above Data Pipeline, click on the Hierarchies option.
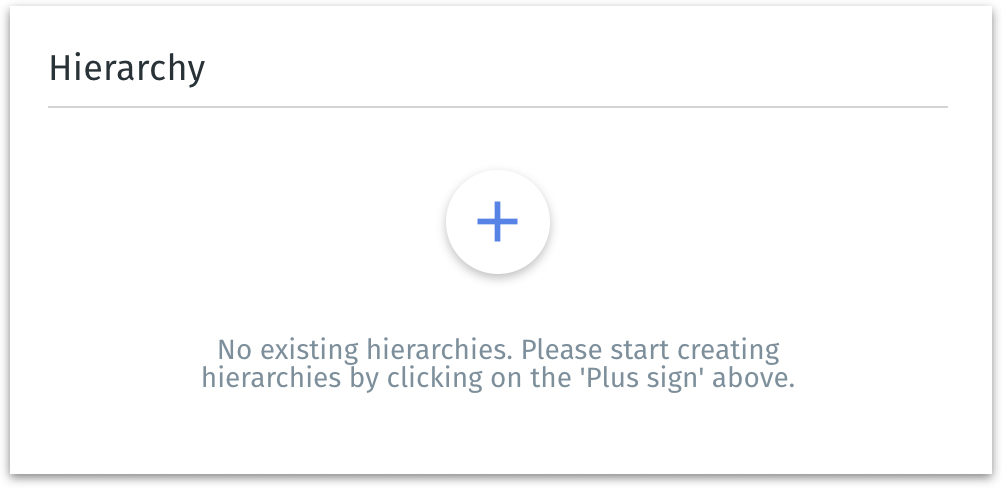
The following window will be displayed if there are no exisiting hierarchies.
Click on the Plus (+) icon. This action initializes a blank hierarchy structure with no predefined fields.
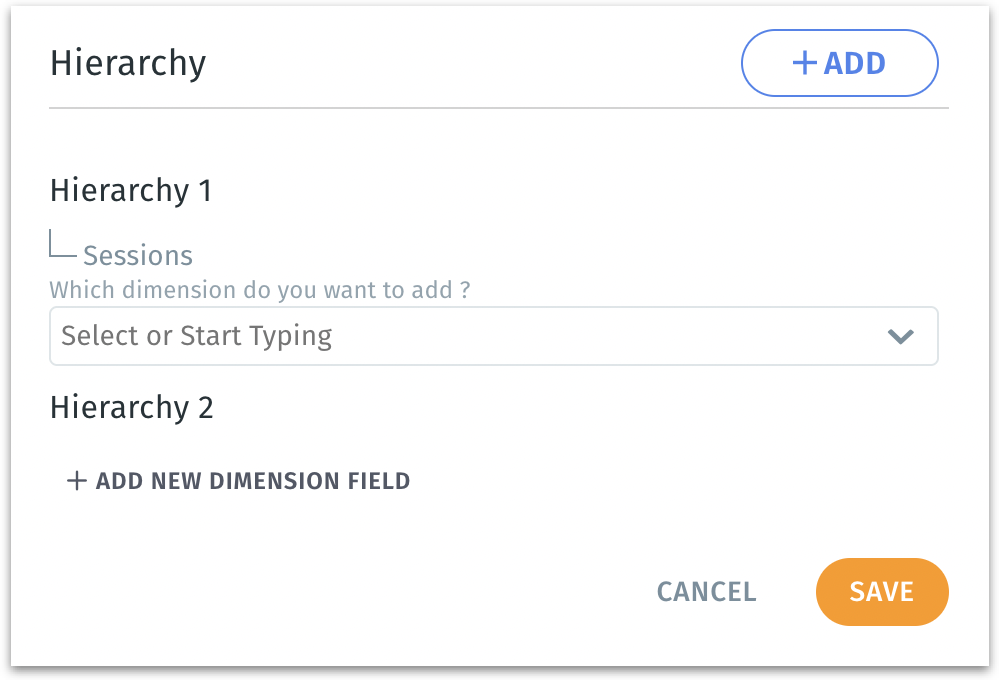
Click on the โAdd New Dimension Fieldโ button. This opens a dropdown where you can select the field to include in your hierarchy. Example: Start with "Country" as your first dimension.
Repeat the process to add more fields. Each field added to the hierarchy represents a level in the drill-down structure. For example, add "State" as the second level, followed by "City" as the third.
To create additional hierarchies, click on the + Add button.
Click on the Hierarchy 1 field at the top to rename the hierarchy.
After completing the setup, click Save or click on Cancel to dismiss. The hierarchy is now embedded in your data pipeline.