Tellius
  • ๐ŸšฉGetting Started
    • ๐Ÿ‘‹Say Hello to Tellius
      • Glossary
      • Tellius 101
      • Navigating around Tellius
      • Guided tours for quick onboarding
    • โšกQuick Start Guides
      • Search
      • Vizpads (Explore)
      • Insights (Discover)
    • โœ…Best Practices
      • Search
      • Vizpads (Explore)
      • Insights (Discover)
      • Predict
      • Data
    • โฌ‡๏ธInitial Setup
      • Tellius architecture
      • System requirements
      • Installation steps for Tellius
      • Customizing Tellius
    • Universal Search
    • ๐Ÿ Tellius Home Page
  • Kaiya
    • โ™Ÿ๏ธUnderstanding AI Agents & Agentic Flows
      • Glossary
      • Composer
      • ๐Ÿ—๏ธTriggering an agentic workflow
      • The art of possible
      • Setting up LLM for Kaiya
    • ๐ŸคนKaiya conversational AI
      • โ“FAQs on Kaiya Conversations
      • Triggering Insights with "Why" questions
      • Mastering Kaiya conversational AI
  • ๐Ÿ”Search
    • ๐Ÿ‘‹Get familiar with our Search interface
    • ๐Ÿค”Understanding Tellius Search
    • ๐Ÿ“Search Guide
    • ๐Ÿš€Executing a search query
      • Selecting a Business View
      • Typing a search query
      • Constructing effective search queries
      • Marketshare queries
    • ๐Ÿ”‘Analyzing search results
      • Understanding search results
      • Search Inspector
      • Time taken to execute a query
      • Interacting with the resulting chart
    • ๐Ÿ“ŠKnow your charts in Tellius
      • Understanding Tellius charts
      • Variations of a chart type
      • Building charts from Configuration pane
      • List of chart-specific fields
      • Adding columns to fields in Configuration pane
      • Absolute and percentage change aggregations
      • Requirements of charts
      • Switching to another chart
      • Formatting charts
      • Advanced Analytics
      • Cumulative line chart
    • ๐Ÿง‘โ€๐ŸซHelp Tellius learn
    • ๐Ÿ•ต๏ธโ€โ™‚๏ธSearch history
    • ๐ŸŽ™๏ธVoice-driven search
    • ๐Ÿ”ดLive Query mode
  • ๐Ÿ“ˆVizpads (Explore)
    • ๐Ÿ™‹Meet Vizpads!
    • ๐Ÿ‘‹Get familiar with our Vizpads
    • #๏ธโƒฃMeasures, dimensions, date columns
    • โœจCreating Vizpads
    • ๐ŸŒApplying global filters
      • Filters in multi-BV Vizpads
      • Filters using common columns
    • ๐Ÿ“ŒApplying local filters
    • ๐Ÿ“…Date picker in filters
      • Customizing the calendar view
    • โœ…Control filters
      • Multi-select list
      • Single-select list
      • Range slider
      • Dropdown list
    • ๐Ÿ‘๏ธActions in View mode
      • Interacting with the charts
    • ๐Ÿ“Actions in Edit mode
      • ๐Ÿ—จ๏ธViz-level actions
    • ๐Ÿ”งAnomaly management for line charts
      • Instance level
      • Vizpad level
      • Chart level
    • โณTime taken to load a chart
      • Instance level
      • Vizpad level
      • Chart level
    • โ™Ÿ๏ธWorking with sample datasets
    • ๐Ÿ”Swapping Business View of charts
      • Swapping only the current Vizpad
      • Swapping multiple objects
      • Configuring the time of swap
    • ๐Ÿค–Explainable AI charts
  • ๐Ÿ’กInsights (Discover)
    • ๐Ÿ‘‹Get familiar with our Insights
    • โ“Understanding the types of Insights
    • ๐Ÿ•ต๏ธโ€โ™‚๏ธDiscovery Insights
    • โž•How to create new Insights
      • ๐Ÿ”›Creating Discovery Insight
      • ๐Ÿ”‘Creating Key Driver Insights
      • ใ€ฐ๏ธCreating Trend Insights
      • ๐Ÿ‘ฏCreating Comparison Insights
    • ๐ŸงฎThe art of selecting columns for Insights
      • โžก๏ธHow to include/exclude columns?
  • ๐Ÿ”ขData
    • ๐Ÿ‘‹Get familiar with our Data module
    • ๐Ÿฅ‚Connect
    • ๐ŸชนCreate new datasource
      • Connecting to Oracle database
      • Connecting to MySQL database
      • Connecting to MS SQL database
      • Connecting to Postgres SQL database
      • Connecting to Teradata
      • Connecting to Redshift
      • Connecting to Hive
      • Connecting to Azure Blob Storage
      • Connecting to Spark SQL
      • Connecting to generic JDBC
      • Connecting to Salesforce
      • Connecting to Google cloud SQL
        • Connecting to a PostgreSQL cloud SQL instance
        • Connecting to an MSSQL cloud SQL instance
        • Connecting to a MySQL Cloud SQL Instance
      • Connecting to Amazon S3
      • Connecting to Google BigQuery
        • Steps to connect to a Google BigQuery database
      • Connecting to Snowflake
        • OAuth support for Snowflake
        • Integrating Snowflake with Azure AD via OAuth
        • Integrating Snowflake with Okta via OAuth
        • Azure PrivateLink
        • AWS PrivateLink
        • Best practices
      • Connecting to Databricks
      • Connecting to Databricks Delta Lake
      • Connecting to an AlloyDB Cluster
      • Connecting to HDFS
      • Connecting to Looker SQL Interface
      • Loading Excel sheets
      • ๐ŸšงUnderstanding partitioning your data
    • โณTime-to-Live (TTL) and Caching
    • ๐ŸŒทRefreshing a datasource
    • ๐ŸชบManaging your datasets
      • Swapping datasources
    • ๐ŸฃPreparing your datasets
      • ๐ŸคพActions that can be done on a dataset
      • Data Pipeline
      • SQL code snippets
      • โœ๏ธWriteback window
      • ๐ŸงฉEditing Prepare โ†’ Data
      • Handling null or mismatched values
      • Metadata view
      • List of icons and their actions
        • Functions
        • SQL Transform
        • Python Transform
        • Standard Aggregation
        • Creating Hierarchies
      • Dataset Scripting
      • Fusioning your datasets
      • Scheduling refresh for datasets
    • ๐ŸฅPreparing your Business Views
      • ๐ŸŒŸCreate a new Business View
      • Creating calculated columns
      • Creating dynamic parameters
      • Scheduling refresh for Business Views
      • Setting up custom calendars
    • Tellius Engine: Comparison of In-Memory vs. Live Mode
  • Feed
    • ๐Ÿ“ฉWhat is a Feed in Tellius?
    • โ—Alerts on the detection of anomalies
    • ๐Ÿ“ฅViewing and deleting metrics
    • ๐Ÿ–ฒ๏ธTrack a new metric
  • Assistant
    • ๐Ÿ’Introducing Tellius Assistant
    • ๐ŸŽคVoice-based Assistant
    • ๐Ÿ’ฌInteracting with Assistant
    • โ†–๏ธSelecting Business View
  • Embedding Tellius
    • What you should know before embedding
    • Embedding URL
      • ๐Ÿ“ŠEmbedding Vizpads
        • Apply and delete filters
        • Vizpad-related actionTypes
        • Edit, save, and share a Vizpad
        • Keep, remove, drill sections
        • Adding a Viz to a Vizpad
        • Row-level policy filters
      • ๐Ÿ’กEmbedding Insights
        • Creating and Viewing Insights
      • ๐Ÿ”ŽEmbedding Search
        • Search query execution
      • Embedding Assistant
      • ๐Ÿช„Embedding Kaiya
      • Embedding Feed
  • API
    • Insights APIs
    • Search APIs
    • Authentication API (Login API)
  • โœจWhat's New
    • Release 5.4
      • Patch 5.4.0.x
    • Release 5.3
      • Patch 5.3.1
      • Patch 5.3.2
      • Patch 5.3.3
    • Release 5.2
      • Patch 5.2.1
      • Patch 5.2.2
    • Release 5.1
      • Patch 5.1.1
      • Patch 5.1.2
      • Patch 5.1.3
    • Release 5.0
      • Patch 5.0.1
      • Patch 5.0.2
      • Patch 5.0.3
      • Patch 5.0.4
      • Patch 5.0.5
    • Release 4.3 (Fall 2023)
      • Patch 4.3.1
      • Patch 4.3.2
      • Patch 4.3.3
      • Patch 4.3.4
    • Release 4.2
      • Patch 4.2.1
      • Patch 4.2.2
      • Patch 4.2.3
      • Patch 4.2.4
      • Patch 4.2.5
      • Patch 4.2.6
      • Patch 4.2.7
    • Release 4.1
      • Patch 4.1.1
      • Patch 4.1.2
      • Patch 4.1.3
      • Patch 4.1.4
      • Patch 4.1.5
    • Release 4.0
Powered by GitBook

ยฉ 2025 Tellius

On this page
  • ๐Ÿš€ New features
  • Swapping of Business Views for multiple objects
  • Google CloudSQL + AlloyDB connectors
  • Bulk operation and sample data for calculated columns
  • Integrated search functionality
  • Axis selection for measures
  • Custom legend positioning and sorting
  • Customizable data labels for boundary maps
  • ๐Ÿ“ˆ Enhancements
  • ๐Ÿ› ๏ธ Minor fixes

Was this helpful?

Export as PDF
  1. What's New
  2. Release 4.2

Patch 4.2.3

PreviousPatch 4.2.2NextPatch 4.2.4

Last updated 3 days ago

Was this helpful?

We're excited to announce the release of Tellius v4.2.3, a substantial step forward in providing an enhanced, intuitive, and streamlined user experience. We've introduced new features, including robust search functionality across various sections, additional formatting options for charts, and the ability to handle calculated columns in bulk. We believe these changes will improve your data management and visualization capabilities.

๐Ÿš€ New features

Swapping of Business Views for multiple objects

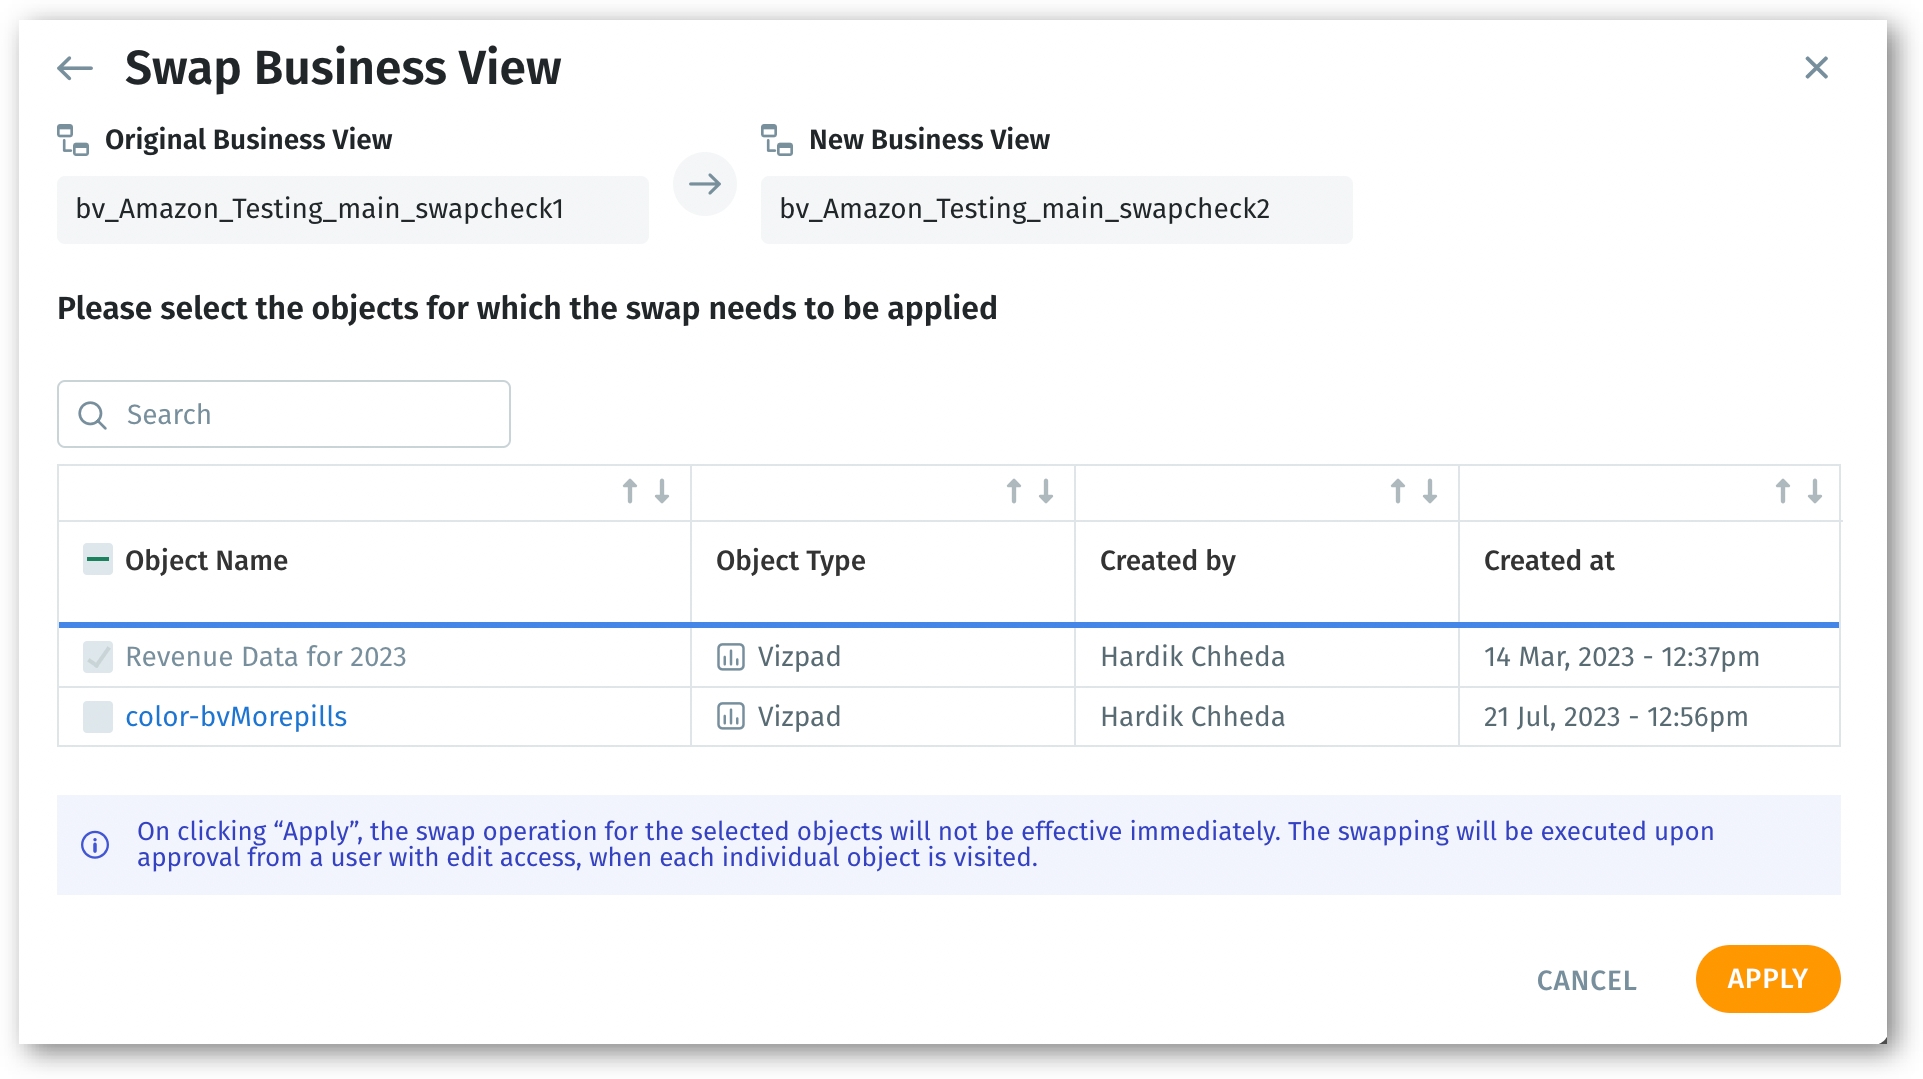
While swapping the underlying Business View of any object, users can simultaneously select multiple objects (Vizpads/Insights/Models) for which the Business Views need to be swapped. The swapping operation of the selected objects can be set up and will be effective once it is approved by a user with edit access.

Swapping Business View

Google CloudSQL + AlloyDB connectors

We are excited to introduce CloudSQL Connectors, further enhancing our commitment to seamless integration.

Google Cloud Platform's (GCP) Cloud SQL simplifies the process of setting up, managing, and administering relational databases on Google Cloud Platform. With this release, we've integrated CloudSQL connectors to directly access your MySQL, MSSQL, and PostgreSQL Cloud SQL instances from the Tellius platform. Additionally, weโ€™ve introduced a new connector for AlloyDB, which allows you to establish a connection from Tellius to your AlloyDB cluster using the AlloyDB Auth Proxy.

Bulk operation and sample data for calculated columns

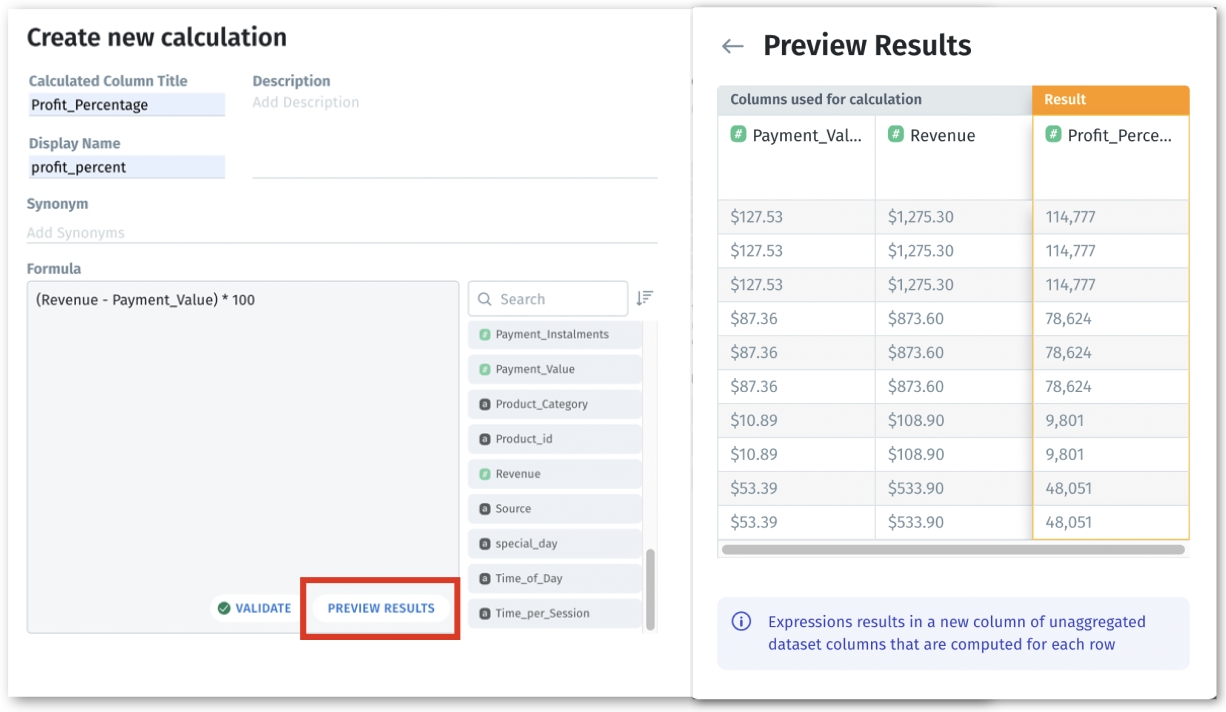
To streamline the data management process, we have added the ability to add or delete calculated columns in bulk. While creating a new calculated column, after validating the formula, users can also preview the results for a limited set of data.

Integrated search functionality

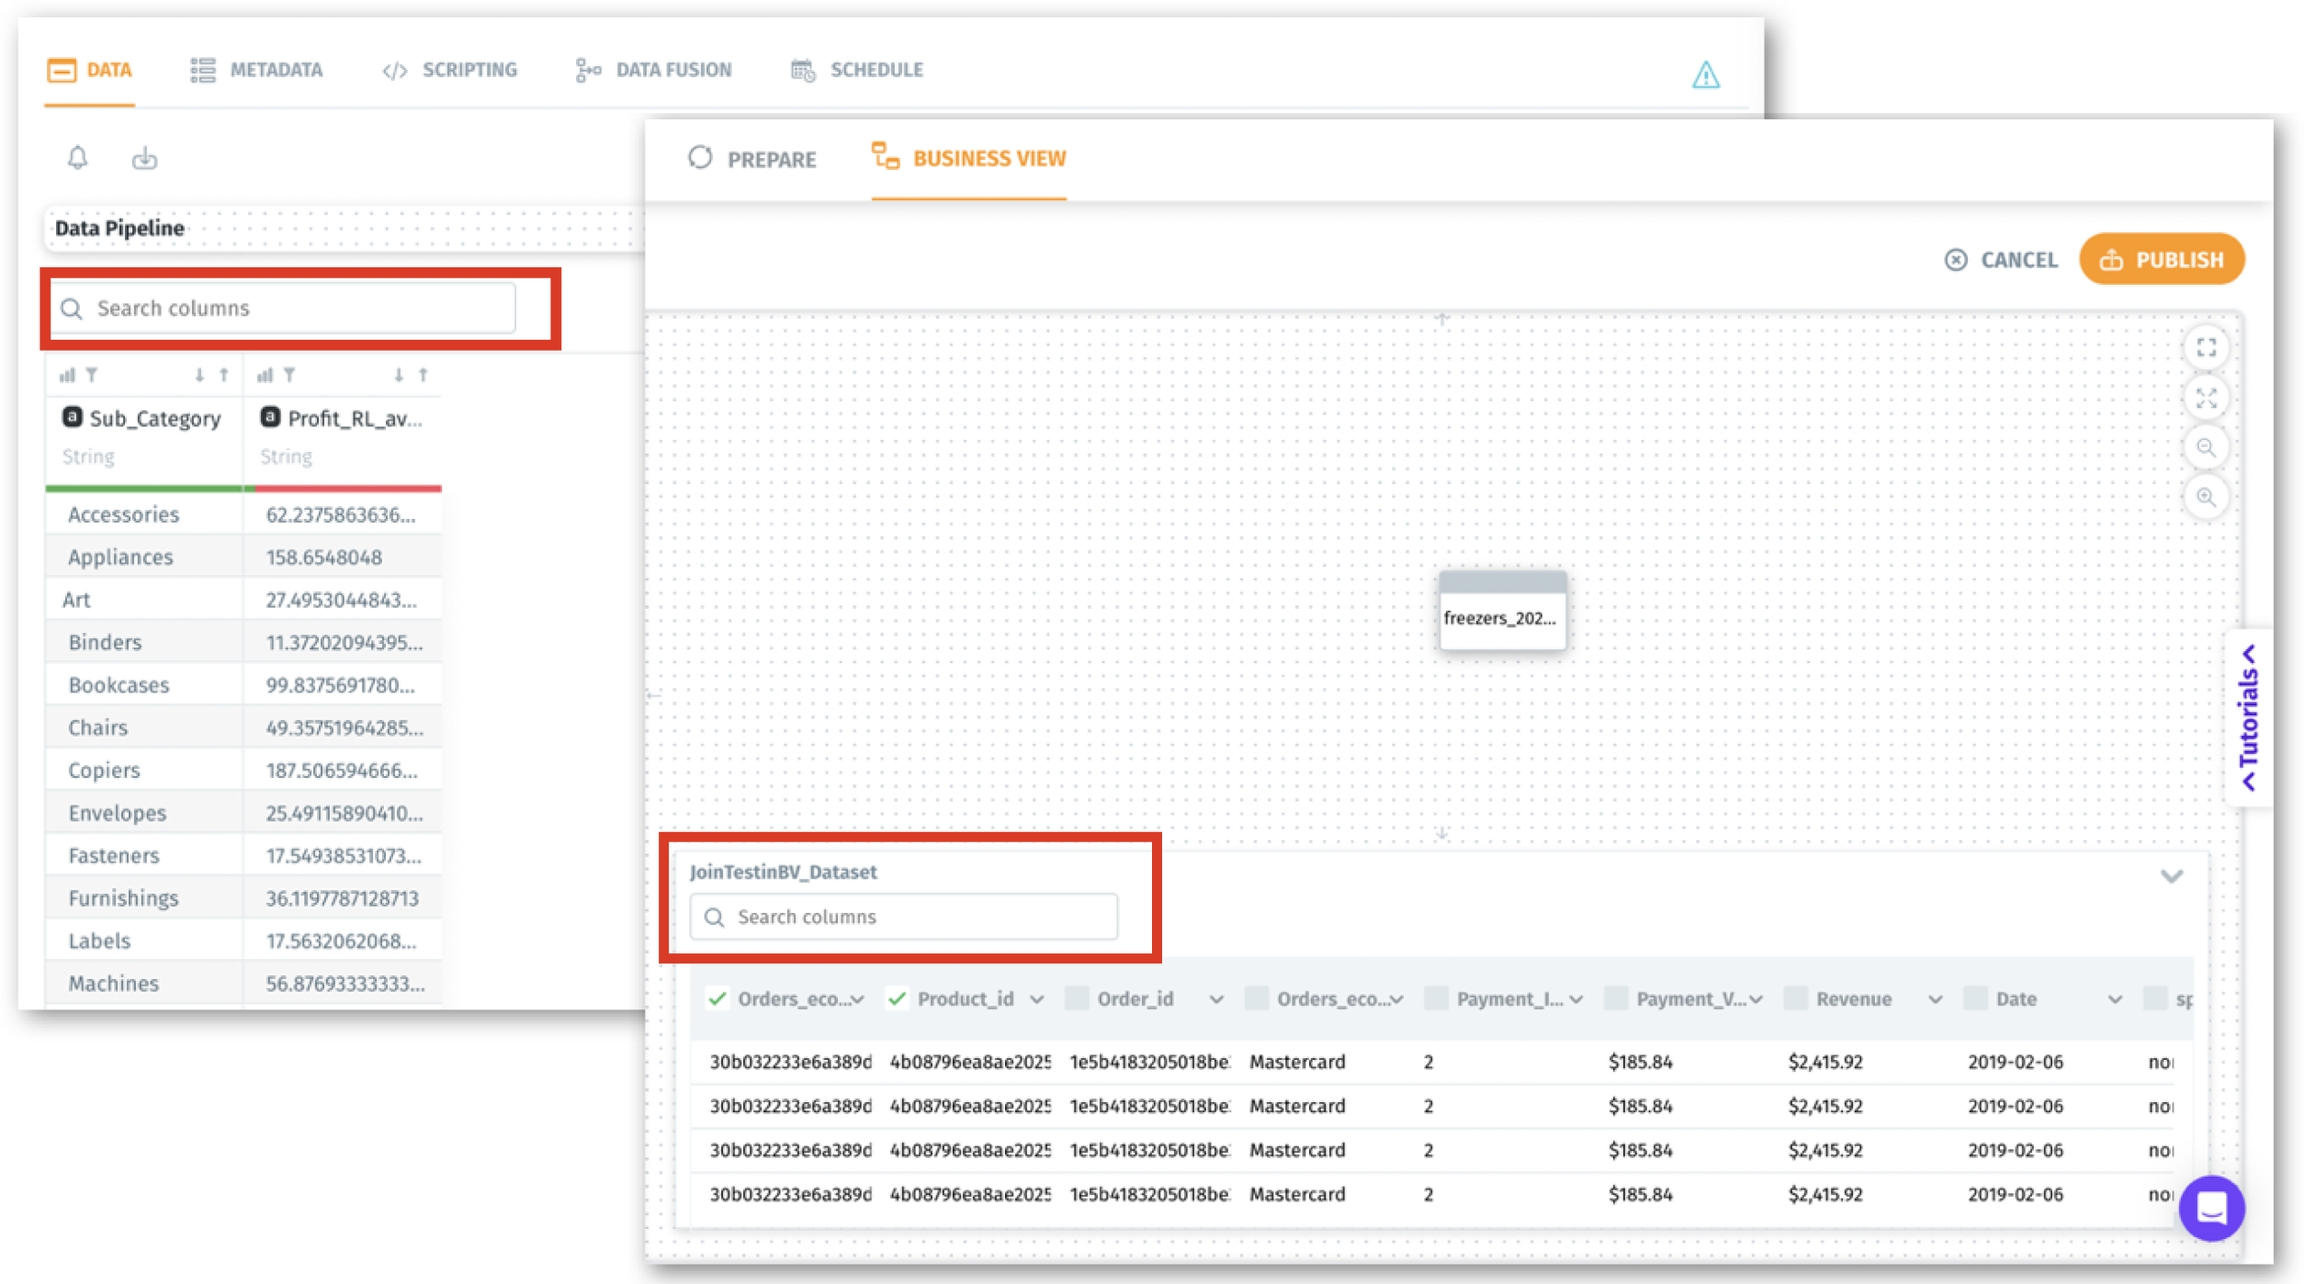
We've introduced a search bar for columns in the Prepare tab and Business View tab (Edit mode) of the Data section. This feature will make navigating and finding the required columns significantly easier.

Axis selection for measures

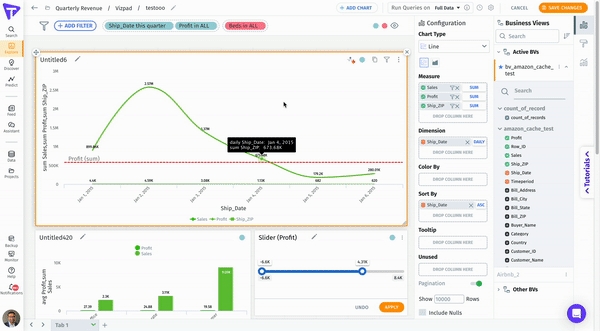
Users now have the option to choose the Y1 or Y2 axis for the measures in bar and line charts. After enabling Dual Axis for the chart, users can switch between Y1 and Y2 for the selected measures. This capability allows for greater flexibility and customization when representing their data.

Custom legend positioning and sorting

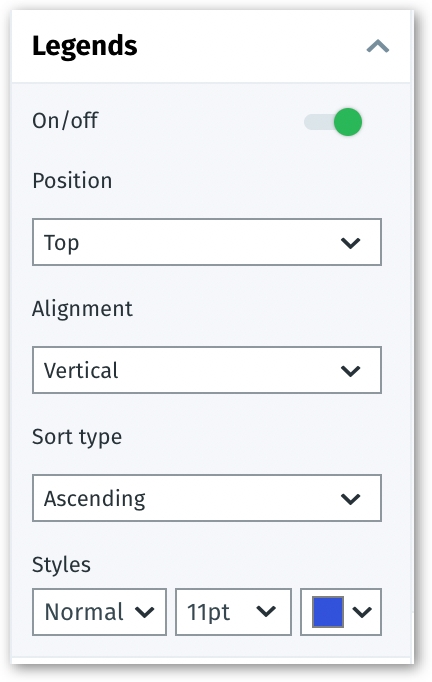
Users can now customize the position of the legends in their charts. Additionally, users can also sort these legends according to their preference.

Customizable data labels for boundary maps

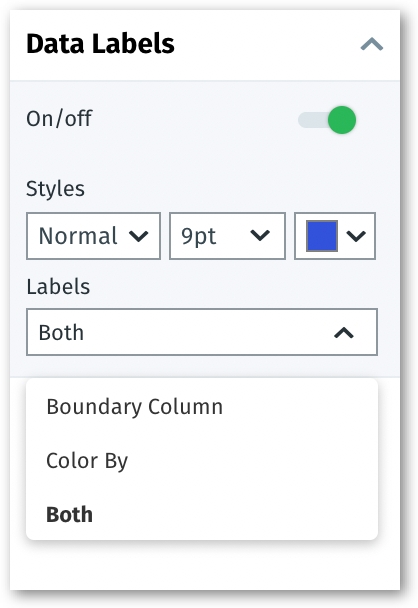
To provide better clarity, we've included customization of data labels for the boundary map, enabling you to quickly and easily identify specific regions on the map.

๐Ÿ“ˆ Enhancements

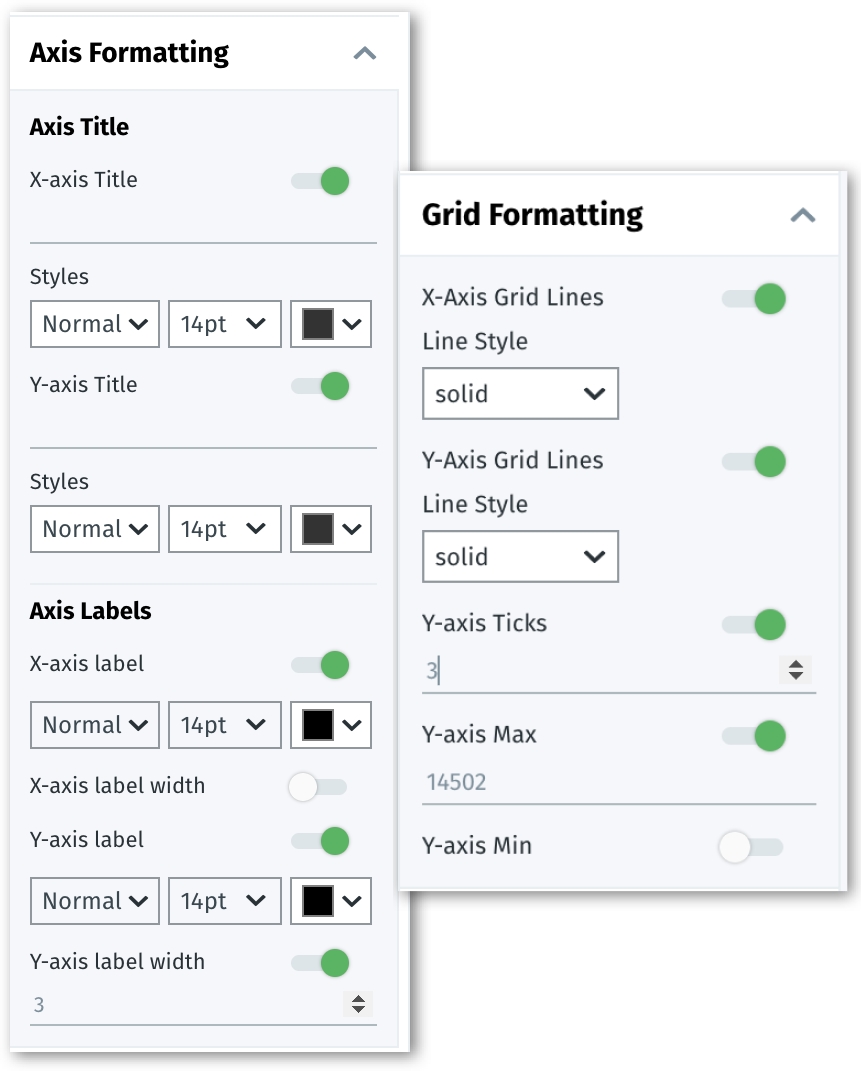
  1. Axis formatting and grid formatting have been incorporated into bar conversion charts. Additionally, grid formatting has been extended to histogram and confidence range charts.

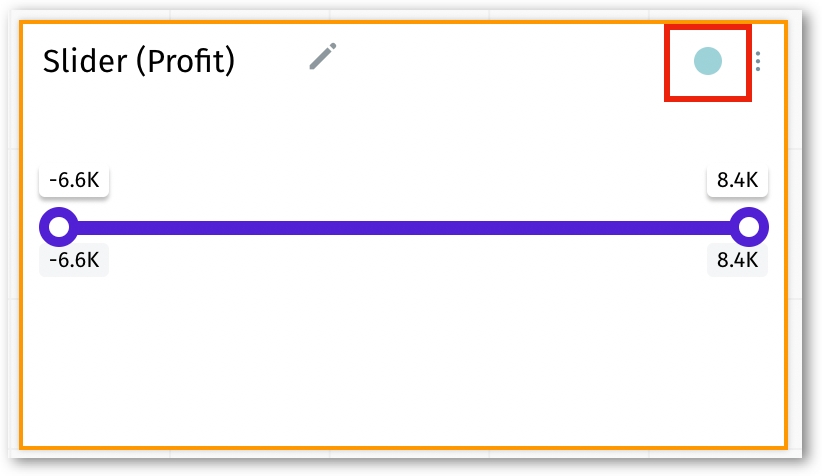
  2. The values displayed in the slider range control filters now inherit the formatting applied on the underlying Business View. For example, in the screenshot below, it inherits the suffix "K" for the numeric values. Also, the Business View names in the form of colored circles will be displayed in the top right corner.

  1. When you're dealing with more than 1000 filter values in a control filter, the total count will now be displayed as '999+' instead of the exact count.

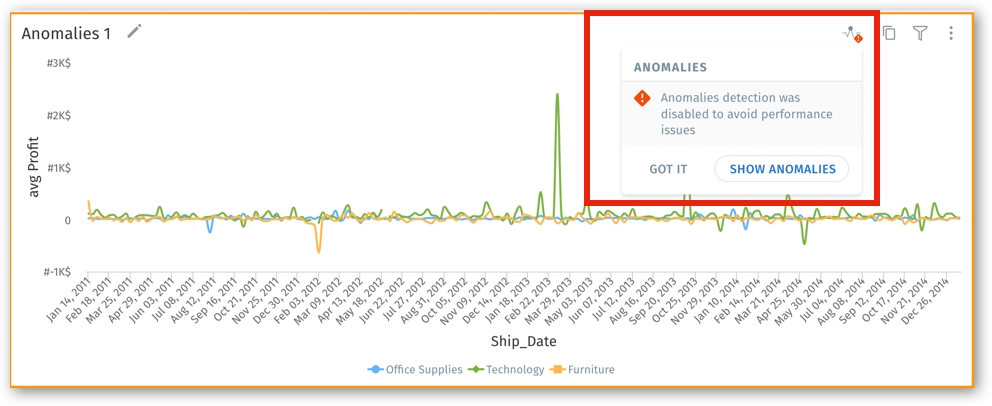
  1. Improved the visibility and positioning of the anomaly warning message in Search and Vizpads.

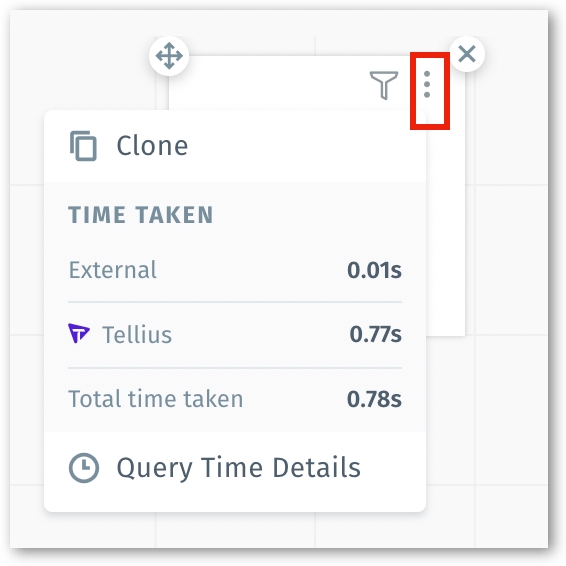
  1. In Vizpads, the alignment of viz icons in charts with 2x2 dimensions has been improved. The options can be found in the three-dot kebab menu as follows.

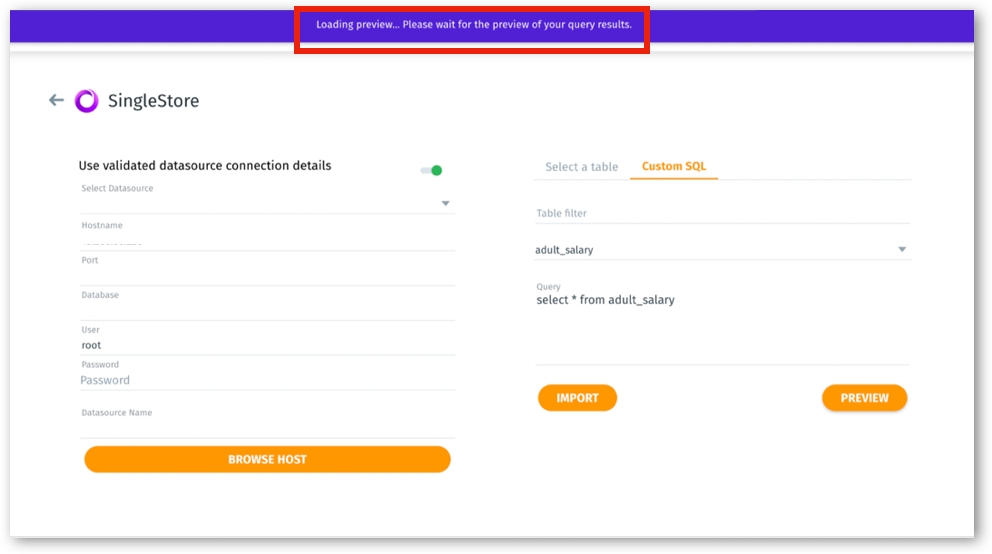
  1. A notification message will be displayed when users click on "Preview" for custom SQL queries.

  1. In multi-Business View Vizpads, users can now add charts upto 30 different Business Views.

  2. Users can now include five or more measures in a line chart.

  3. To ensure seamless navigation through long lists, we've introduced "virtual scrolling." With this, only the items that are visible in the viewport will be loaded and rendered. As you scroll, new items come into view and are loaded dynamically, improving the performance and responsiveness of the platform.

  4. The unused objects in memory have been identified and removed to achieve a substantial reduction in heap memory usage. This helps the platform to perform better with quicker load times, smoother navigation, and an overall more responsive user experience.

  5. Multiple control filters can be added for a single column in a Vizpad for more flexibility. However, please note that multi-select control filters can be paired with dropdown lists but not be paired with single-select control filters. The same holds true vice versa.

๐Ÿ› ๏ธ Minor fixes

  1. The grid layout in the Search Guide section will consistently maintain a 3x3 format, regardless of screen size changes.

  2. The Configuration panel will be displayed by default when a new chart is added to a Vizpad, regardless of the previously active tab.

  3. In Tellius Copilot, the issue with validating SQL/Python code has been fixed. Additionally, the auto-generated queries have been improved.

  4. During key driver insight creation, the issue with displaying column names when switching between measures and dimensions has been resolved.

  5. Any new Feed creation with a changed "Include attachment" setting, previously set by another user, will be considered a new Feed.

  6. In Vizpads, improved the handling of min and max states of slider range control filters.

  7. The Create Dataflow option has been removed from the users permissions/roles table.

  8. The issue with updating the title of a control filter after switching its type has been resolved.

  9. In Vizpads, the issue with displaying consistent time taken to load charts when switching between multiple pages has been resolved.

  10. Subscribers will no longer see the โ€œDeleteโ€ option for Feeds that are not created by them.

  11. The pop-up message thatโ€™s displayed when sharing a Project in โ€œEditโ€ and โ€œViewโ€ mode has been updated.

  12. The issue with displaying the benchmark line in Vizpad charts when the value is out of the Y-axis range has been fixed.

  13. Resolved the issue of incorrect duplication warnings in display names after dataset replacement.

  14. Fixed the issue where formatting applied to one chart was replicated on other charts in a Vizpad.

  15. Resolved an issue where the boundary map chart for states used incorrect color for max value.

  16. Improved the tooltip positioning over global filter pills in the Edit mode of Vizpads.

  17. Eliminated an issue that caused infinite scrolling on tooltips for tables with dimension columns containing large values.

  18. Resolved the issue where the description tooltips obstructed the fields in the Configuration panel in Vizpads.

  19. The screen that displays Insights results now supports longer column names with ellipsis and tooltips for easier reading.

  20. Removed incorrect anomaly warnings when dimension columns are used as x-axes in line charts.

  21. Fixed the positioning of the text cursor while typing in a text viz in Vizpads.

  22. The issue with creating ML models from Vizpad has been resolved.

  23. Resolved the tooltip issues on multiple Insights UI screens.

  24. Resolved the issue that caused the KPI target chart to lose target values after being exported to PDF/PNG/JPG.

  25. Special characters are now accepted in the display names of calculated columns.

  26. In Vizpads, the overlapping issue in the conditional formatting pop-up has been rectified.

  27. The issue with limited space in the โ€œWhatโ€ section of an Insight description has been resolved.

  28. In the results description of Insights, the issue with showing display names has been resolved.

  29. The issue with displaying Search Guide categories in Edit mode has been fixed.

  30. Removed the blank alert that appeared for a newly created dataset on the Prepare page.

Google CloudSQL + AlloyDB
Previewing results in calculated columns
Search in Business Views
Axis selection for measures
Custom legend positioning and sorting
Custom data labels
Axis and grid formatting
Suffix in slider range
Multi-select control filter
Anomaly warning message
Viz menu for 2x2 chart
Notification message
โœจ