Functions
Create custom dataset transformations with Indicators and Signatures in Tellius, using formulas and conditional logic to build new metrics and classifications.
Functions refer to advanced, formula-based transformations you can apply to your datasets. They let you create custom columns or modify existing columns by writing expressions—without needing a separate tool or code editor. Under “Functions”, you’ll find two main categories: Indicators and Signatures
Typically, you’ll pick an Indicator whenever your expression is primarily numeric or aggregator-based, and a Signature when you need more robust, conditional logic (especially if you want to return non-numeric labels).
Indicators
Indicators allow you to create mathematical expressions that transform your data, letting you compute new values or combine existing columns. They are reusable, formula-based calculations you can apply to each row in your dataset. They typically involve arithmetic or aggregations—like avg(SumOfQty_Avail) or (cost - revenue) + profit. Think of them as custom fields that you define using existing columns, so you can enrich your dataset with new metrics on the fly.
Why use Indicators?
By creating a derived metric (e.g.,
(cost - revenue) + profit), you might uncover patterns you’d miss if you only looked at raw fields.After applying your indicator, you can keep your newly enriched dataset in memory (for faster querying) or push it back to a database if you need a persistent record.
How to use Indicators
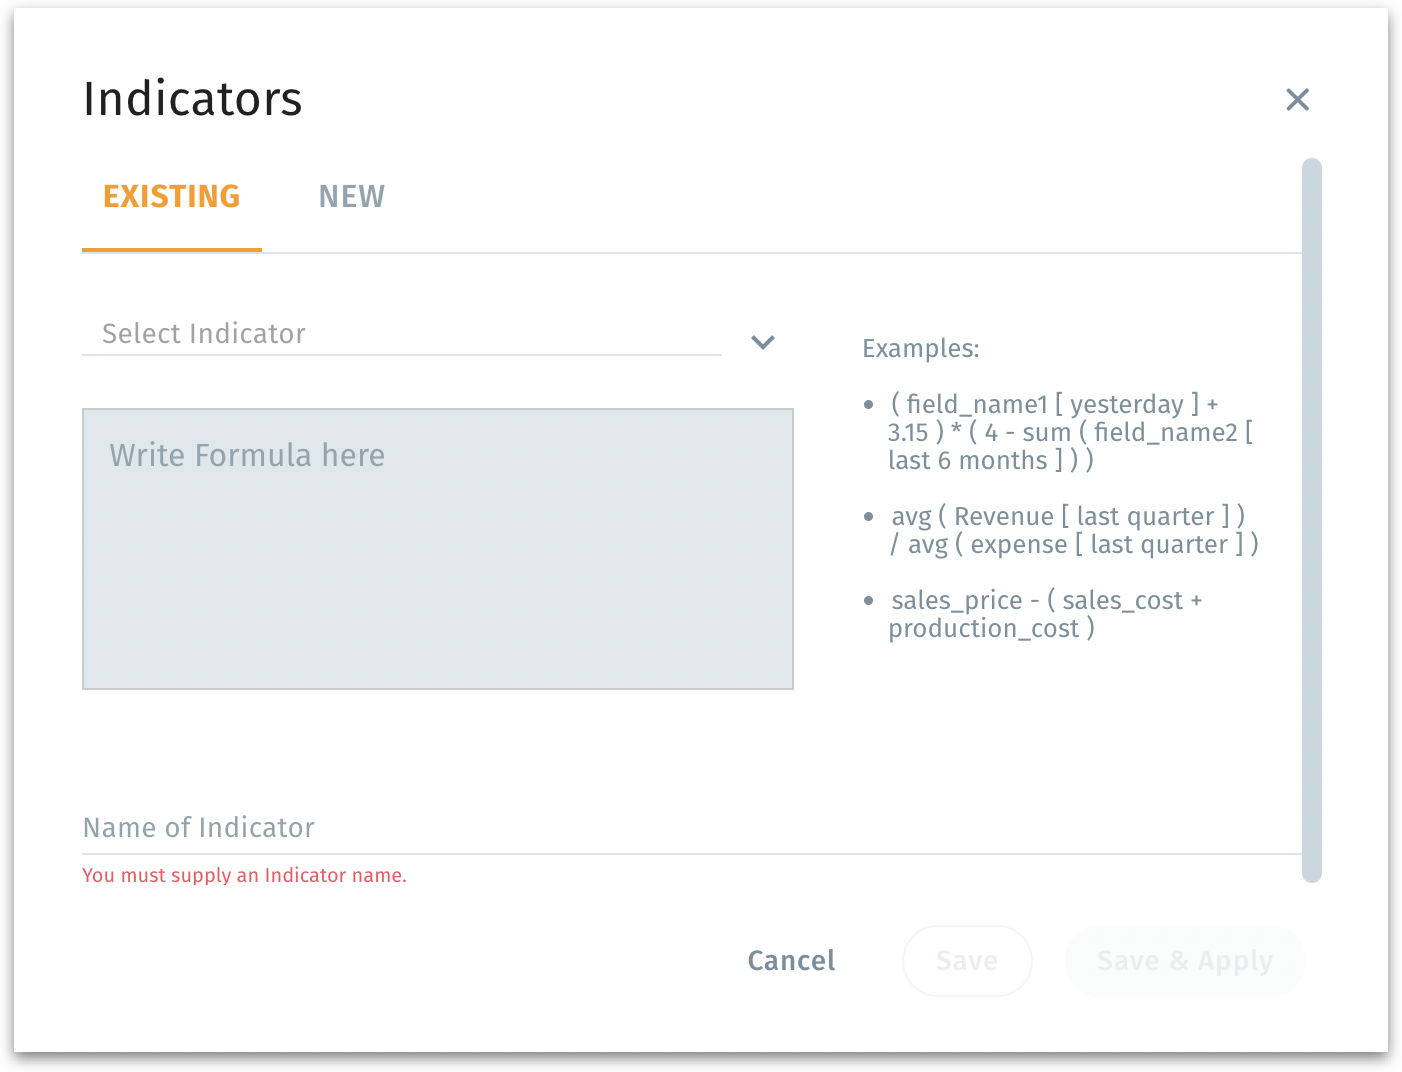
Under Data → Prepare → Data, click on the Functions (f) icon and select Indicators from the menu. The Signatures pop-up features two tabs: Existing and New.

Select the required Indicator from the Select Indicator dropdown.
The text field below shows the formula. It can be adjusted, if required.
Alternatively, you can create a new Indicator by typing the expression in the text field, referencing fields in your dataset. Example:
(cost - revenue) + profit).Provide a name for the Indicator. Based on your requirement, save or apply the expression.
Save: Saves the Indicator in your library but does not immediately apply it to the dataset.
Save & Apply: If you chose “Save & Apply,” the dataset’s pipeline now includes a new column or a transformed set of values derived by your indicator.
Delete: Removes the Indicator entirely if you no longer need it.
If you need complex branching logic (IF-THEN-ELSE), consider whether a Signature is more suitable. Indicators excel at arithmetic or aggregator-based expressions.
Signatures
Signatures are formula-like definitions based on columns in your dataset. They help you classify or calculate values for each row on the fly. You can define conditions (e.g., "if" statements), arithmetic, or more advanced logic. Then you can save and apply these expressions, either storing your new dataset in memory or in a database.
For example:
This expression categorizes each row’s “age” column into youth, teenage, or adult.
Why use Signatures?
You can apply conditional statements (IF, ELSEIF) or arithmetic (like
(revenue - cost) / cost * 100).Once created, the same signature can be applied to multiple analyses or dashboards.
No need to switch tools—perform these custom calculations inline directly in Tellius.
How to create Signatures?
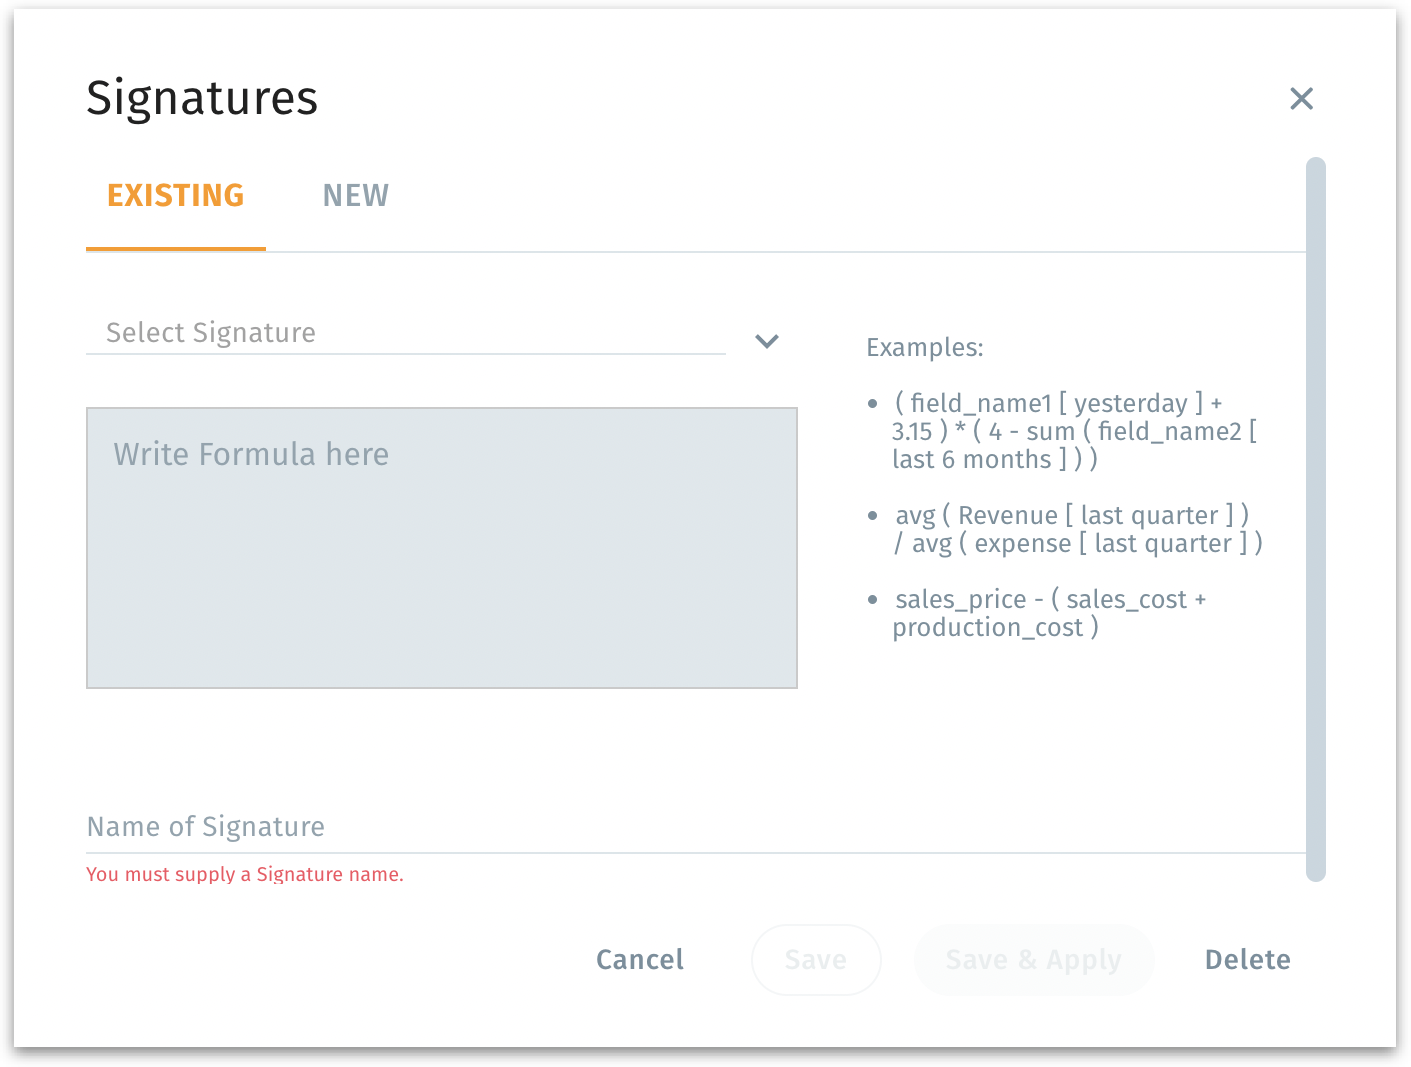
Under Data → Prepare → Data, click on the Functions (f) icon and select Signatures from the menu. The Signatures pop-up features two tabs: Existing and New.

Select the required Signature from the Select Signature dropdown.
The expression will be loaded into the text field below.
Alternatively, you can create a new Signature by typing the expression in the text field, referencing fields in your dataset. Example:
if SCHEDULED_DEPARTURE < 100 then 0 elseif SCHEDULED_DEPARTURE < 200 then 1 else 2.Provide a name for the Signature. Based on your requirement, save or apply the expression.
Save: Saves the signature in your library but does not immediately apply it to the dataset.
Save & Apply: Saves changes and applies the logic to your dataset, so you see the transformed column right away.
Delete: Removes the signature entirely if you no longer need it.
If you only want to update a small part of the logic, open an existing signature, edit the text, then “Save & Apply” to see immediate changes.
A new signature-based column appears in your data pipeline, letting you slice, filter, or visualize that new field in subsequent steps.
After finishing your changes, Tellius may prompt whether you want the final dataset in memory or a database.
Memory: Faster to query; suitable for agile exploration or smaller datasets.
Database: If your organization needs the new columns/logic available to a broader audience or wants to keep it in a persistent store.
You typically choose this storage option after you finish transformations, either in the pipeline settings or during final “Publish” steps.
Indicators vs Signatures
When to use Indicators
If you want to produce a straightforward numeric calculation (averages, sums, differences, ratios).
If you need quick aggregator-based expressions (like
avgorsum) over columns.If you’re mostly dealing with numeric fields and want derived measures or KPIs.
Typical output is a numeric field that can be charted, pivoted, or used in further transformations.
When to use Signatures
If you want to classify or label rows, or apply multi-branch logic (conditional or categorical expressions).
If your expression is a chain of complex conditions or text-based logic, especially where the result might be a string label.
If you’re segmenting data or assigning categories based on certain thresholds or conditions (row-by-row logical checks).
Typical output is a string or label for each row (e.g., “youth,” “adult,” “profit,” “loss”). But it can also produce numeric values if your if/else conditions return numbers.
Was this helpful?