
Patch 4.2.2
Tellius 4.2.2 brings enhanced chart flexibility with Business View swapping, faster data handling via search in metadata, new table formatting options, and a host of usability and performance fixes
We're excited to announce the arrival of Tellius 4.2.2, which delivers key updates and improvements, focusing on enhancing the user experience and product functionality.
Tellius 4.2.2 introduces exciting new features, making data visualization more flexible and efficient. The ability to swap underlying Business Views in Vizpads enables swift transitions between similar datasets while retaining chart configurations. This feature, along with the introduction of search boxes on the Metadata and Calculated Columns pages, will help streamline your data handling process. Version 4.2.2 is all about providing you with a seamless, user-friendly platform, offering the necessary tools to efficiently manage and interpret your data.
🚀 New features
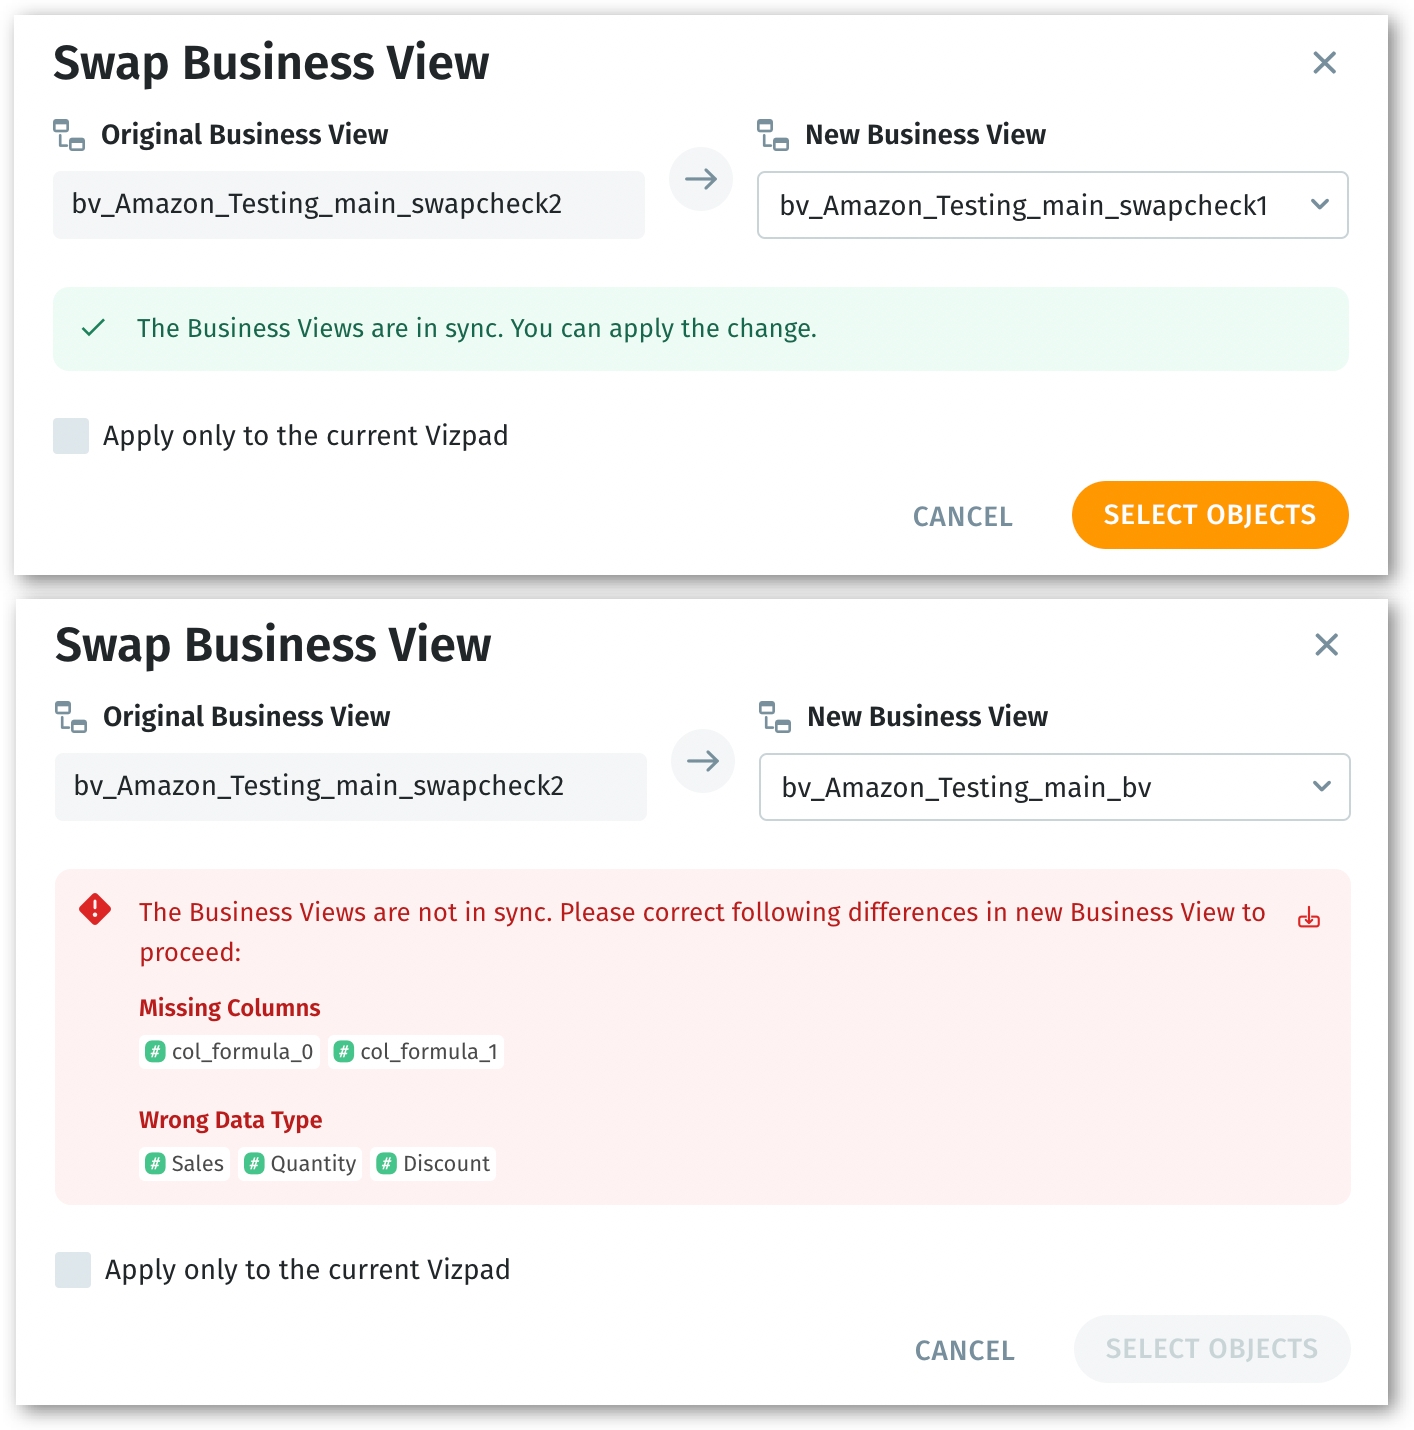
Swapping Business View of Vizpad charts
In Vizpads, users can now swap the underlying Business View of a chart to another required Business View, retaining the same chart and configurations. This would be extremely useful when users need to apply the same visualization to different datasets containing similar columns. For instance, you could swiftly switch a revenue chart from a 2022 dataset to a 2023 dataset, maintaining all existing configurations, and thus enhancing the adaptability and efficiency of charts.
Once the Business View to be swapped has been selected, Tellius will validate whether the two Business Views are consistent with one another and provide feedback on the columns to be modified. This information can be downloaded as a CSV file. The swapping can be applied either to the current tab or all the tabs of the current Vizpad.
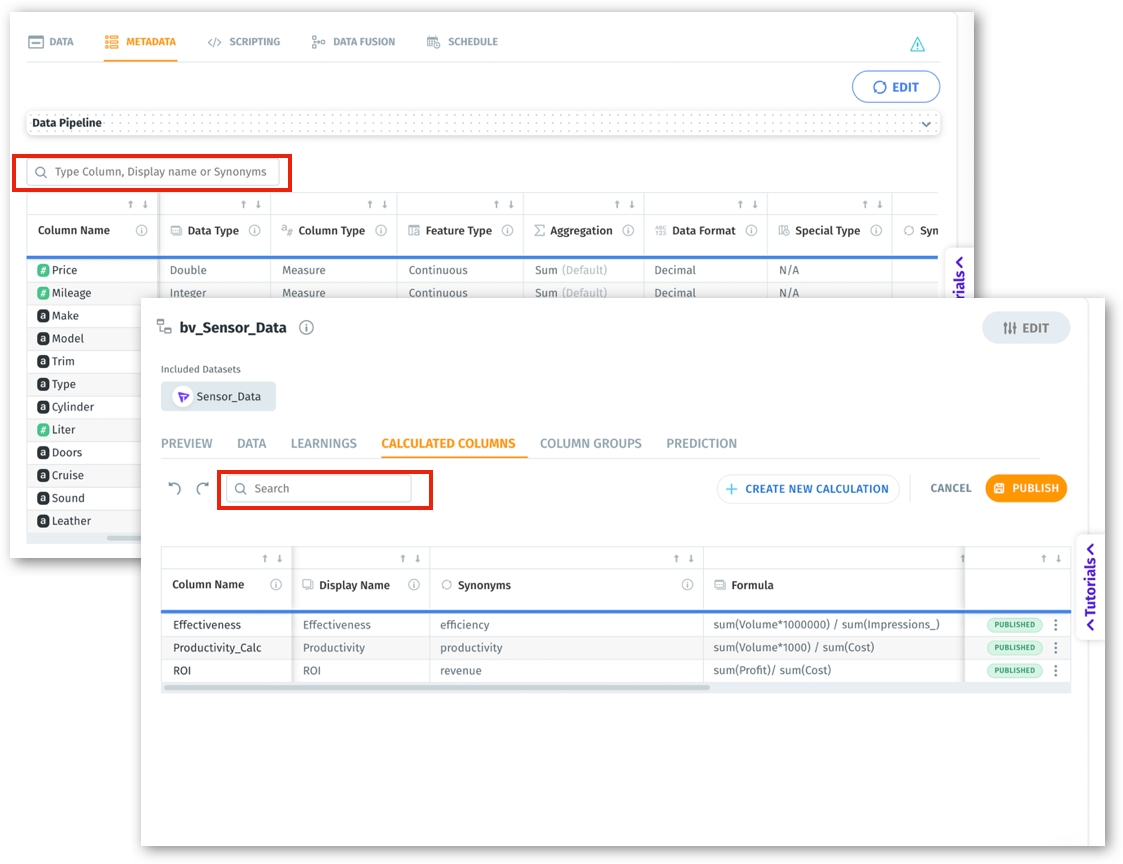
Search boxes in Metadata and Calculated Columns
Users can now leverage the power of search boxes on both the Metadata and Calculated Columns pages. This new feature is designed to improve user experience and accelerate data access, allowing you to effortlessly find essential information.
Text formatting to tables
In Vizpads, text formatting has been added to tables where users can change the font type, color, and size of table headers and table values.
Updating default Business View
When working with multi-Business View Vizpads, users can now easily modify the default Business View.
📈 Enhancements
When instances are getting upgraded, Tellius will now display a more user-friendly page to keep the users informed of the version upgrade/maintenance activities.
Page to inform ongoing upgrade/maintenance The design and usability of control filters have been improved to fit grids of various sizes.
Tellius will display more informative and enhanced error messages in the event of timeouts associated with API calls.
To provide better transparency about the operations happening behind the scenes, Tellius will now display more detailed descriptions for the TQL queries that it runs internally to fetch data such as maximum dates, counts, and other similar operations.
Improvements have been made to the display of subsections under Axis Formatting in Vizpads.
In the Notifications page, for job types with lengthier names, ellipses and tooltips have been introduced to view the full names.
🛠️ Minor fixes
Fixed an issue where Top N queries were returning fewer than N results for certain comparison filters.
Resolved the issue where tooltips were not clearing correctly after selecting an aggregation.
Fixed an issue where color was missing in combo charts after switching between different chart types in Vizpads.
Addressed the issue where legends were not enabled by default for growth and trend charts.
Improved readability and correctness of messages displayed in the Save to Library option.
The issue which was preventing the dragging of columns while editing discovery insights was resolved.
Enhanced the search functionality with measure-based sorting for search results.
Improved the handling of null data in pivot tables and standard tables in Vizpads.
The issue with using the “blank” operator in Vizpad filters has been fixed.
Improved the stability of viz placement when switching tabs in Vizpads.
The issue with applying successful joins on publishing live MySQL, Exasol, and Big Query Business View has been resolved.
Fixed the issue where type changes made from the Metadata page were not being reflected properly.
Resolved an issue that was preventing successful joins on publishing live Delta Lake Business View.
The issue with displaying the user-selected columns correctly during the creation of Segment Driver Insights has been resolved.
During the creation of Insights, the issue with displaying toast messages when columns are switched between Included and Excluded lists has been resolved.
Resolved the issue where scripting was displayed for live datasets.
The issue with refreshing viz filter control values has been resolved.
Added tooltips to multi-select, single-select, and dropdown control filters for improved clarity.
Improved the user interface of Vizpads by addressing certain design inconsistencies.
Enhanced the messaging displayed for applying threshold anomalies in Application Settings.
Resolved alignment issues in the search guide boxes for improved user experience.
The issues with displaying Apply button, scroll buttons, and validation messages when swapping Business Views have been fixed.
Resolved an issue where the last row of the calculated columns was not visible on certain screen sizes.
The issue with saving calculated columns formulae without validating them first has been fixed.
Fixed a bug where an unscheduled refresh job still ran in Azkaban.
The issue with formatting changes made in the Metadata tab formatting not getting reflected in Vizpads was fixed.
Resolved an issue where Vizpads got updated with the previous state after an aggregation change.
Addressed an issue caused by a Spark upgrade that prevented XGBoost Softmax classification models from functioning correctly.
Fixed an issue preventing the visibility of calculated columns on a 14" screen width in Vizpads.
Resolved the issue where the default Business View was not displayed correctly when a viz was added from Search to Vizpads.
Fixed an issue where tooltips were not appearing for certain values on single-select and multi-select viz control filters in View mode of Vizpads.
Fixed a bug caused by a Spark upgrade that led to the failing of SQL script queries in a distributed Spark setup.
The header has been updated to support embedding in the Safari browser.
The issue with applying additional filters when using both top and bottom filters in market share has been fixed.
A warning message will be displayed in a pop-up window after changing the default Business View.
The issue with scrolling synonyms in the Metadata page has been resolved.
On swapping Business View, the issue with displaying the Business View columns pane has been fixed.
Last updated
Was this helpful?