Constructing effective search queries
Search techniques to craft queries that yield the most relevant and comprehensive results.
From basic to complex queries, Tellius' powerful search engine is designed to interpret and analyze a vast array of questions, paving the way for informed decision-making.
This guide explores the skillful and strategic use of search techniques to leverage the full potential of Tellius Search.
Example Query
To demonstrate the query structure, consider the example below:
total revenue by product for New York monthly
Components of the query
Aggregation: Specifies the mathematical operation to be performed on the data.
Keyword:
total
Measure:
revenue
Grouping: Defines how data should be grouped.
Keyword:
by
Dimension:
product
Filtering: Applies conditions to narrow down the data.
Keyword:
for
Value:
New York
Time Resolution: Determines the time frame for the data.
Value:
monthly
Query keywords and values
Groupby Keyword:
by
Used to group data based on a specific dimension.Combined Groupby:
and
Allows for grouping by multiple dimensions.Filter Keyword:
for
,in
Applies a filter to narrow down the data.Time Resolution:
monthly
,yearly
,quarterly
,daily
,weekly
Specifies the temporal granularity of the data.Comparison between Values:
compared to
,vs
Used to set up a comparison between different data sets.Time-based Filters: Examples include
last year
,March 2020
,this week
,Q4 2019
Filters the data based on specific time periods.Additional Logical Functions:
contains
,=
Provides additional logical operations to refine the data.
Constructing a query
When constructing a query, it is essential to combine these components logically to ensure accurate data retrieval. Here's the structure to follow:
Start with an aggregation keyword and the measure you want to analyze.
Use the groupby keyword to define how to break down the measure.
Apply filters using filter keywords and values to specify the subset of data you need.
Define the time resolution to determine the period over which the data should be aggregated.
Starting with Basic Queries
Basic queries that involve direct data retrieval serve as the foundation for any search. Try these straightforward questions, which are excellent starting points for deeper analysis.
Simple data requests
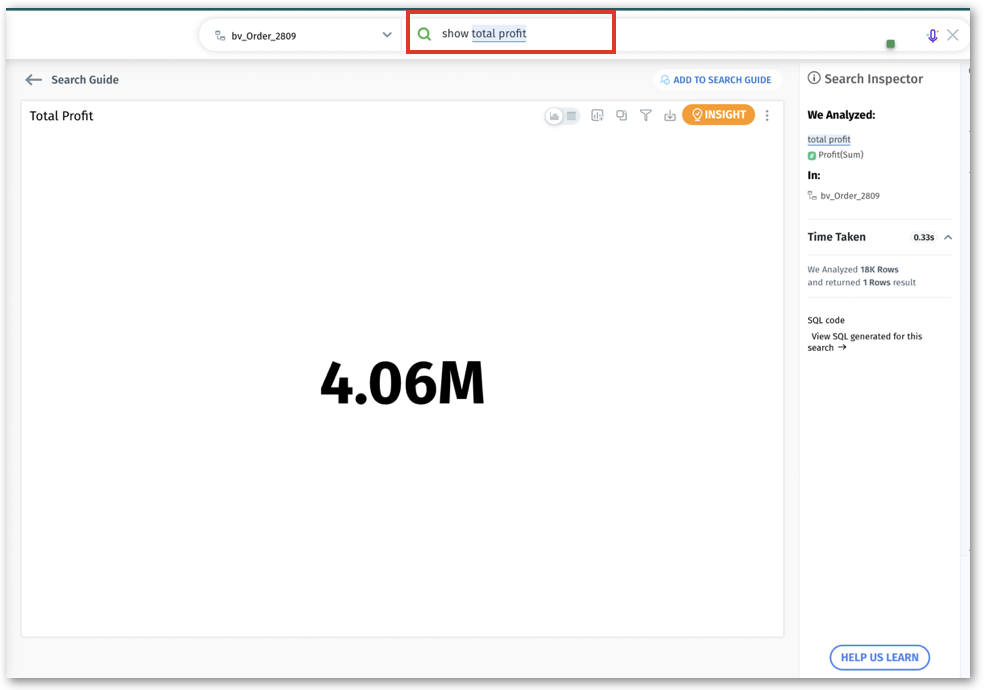
"Show total profit"
"Show average profit in 2023"
Combining multiple parameters
"Show revenue and quantity_sold"
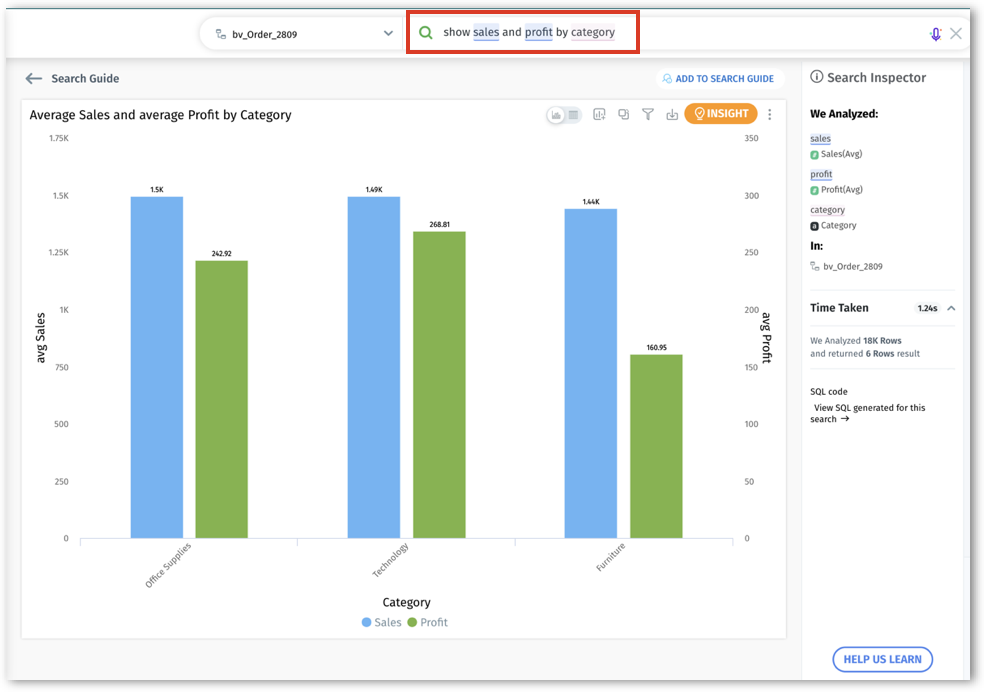
"Show sales and profit by category"
Regional or category-specific queries
"Show count profit for California"
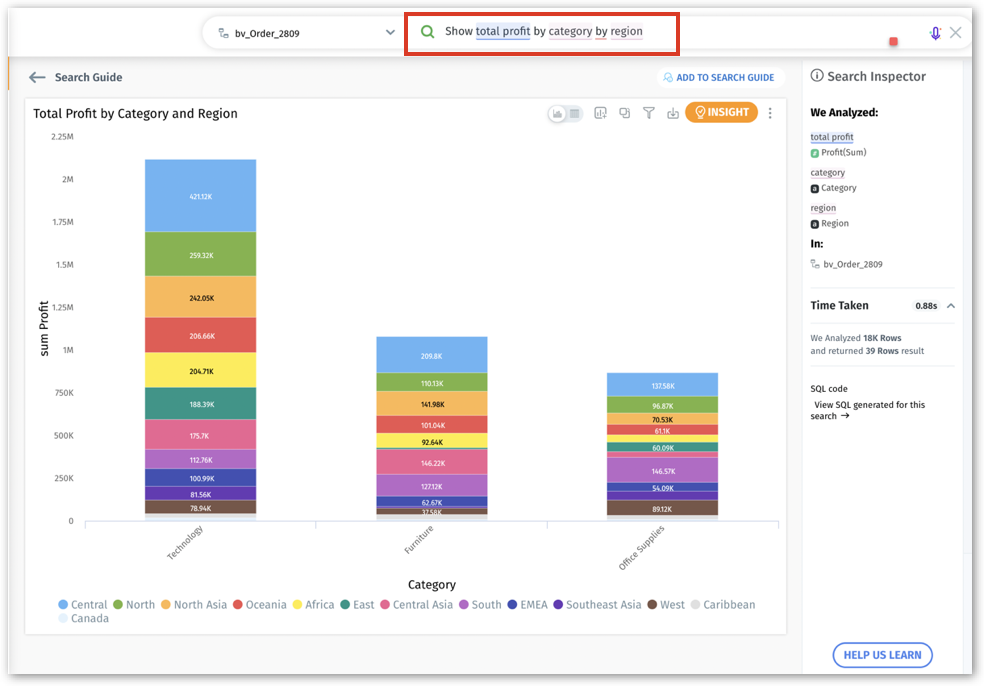
"Show total profit by category by region"
Moving to Intermediate Queries
These queries incorporate multiple elements like time frames, filters, or comparison metrics, offering more refined results.
Filters
Queries that extract data based on specific conditions or criteria.
"Show average profit by country for furniture"
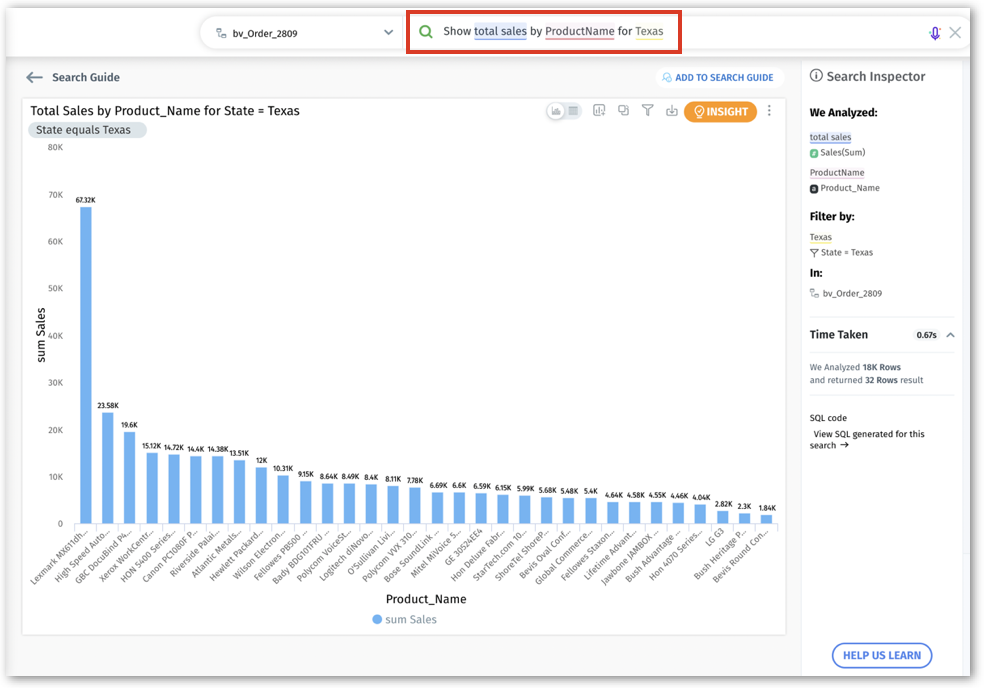
"Show total sales by ProductName for Texas"
"Show total hours worked by Department"
Dates and time ranges
Queries focusing on data within a specified date or time period.
"Show minimum users for the last 2 months"
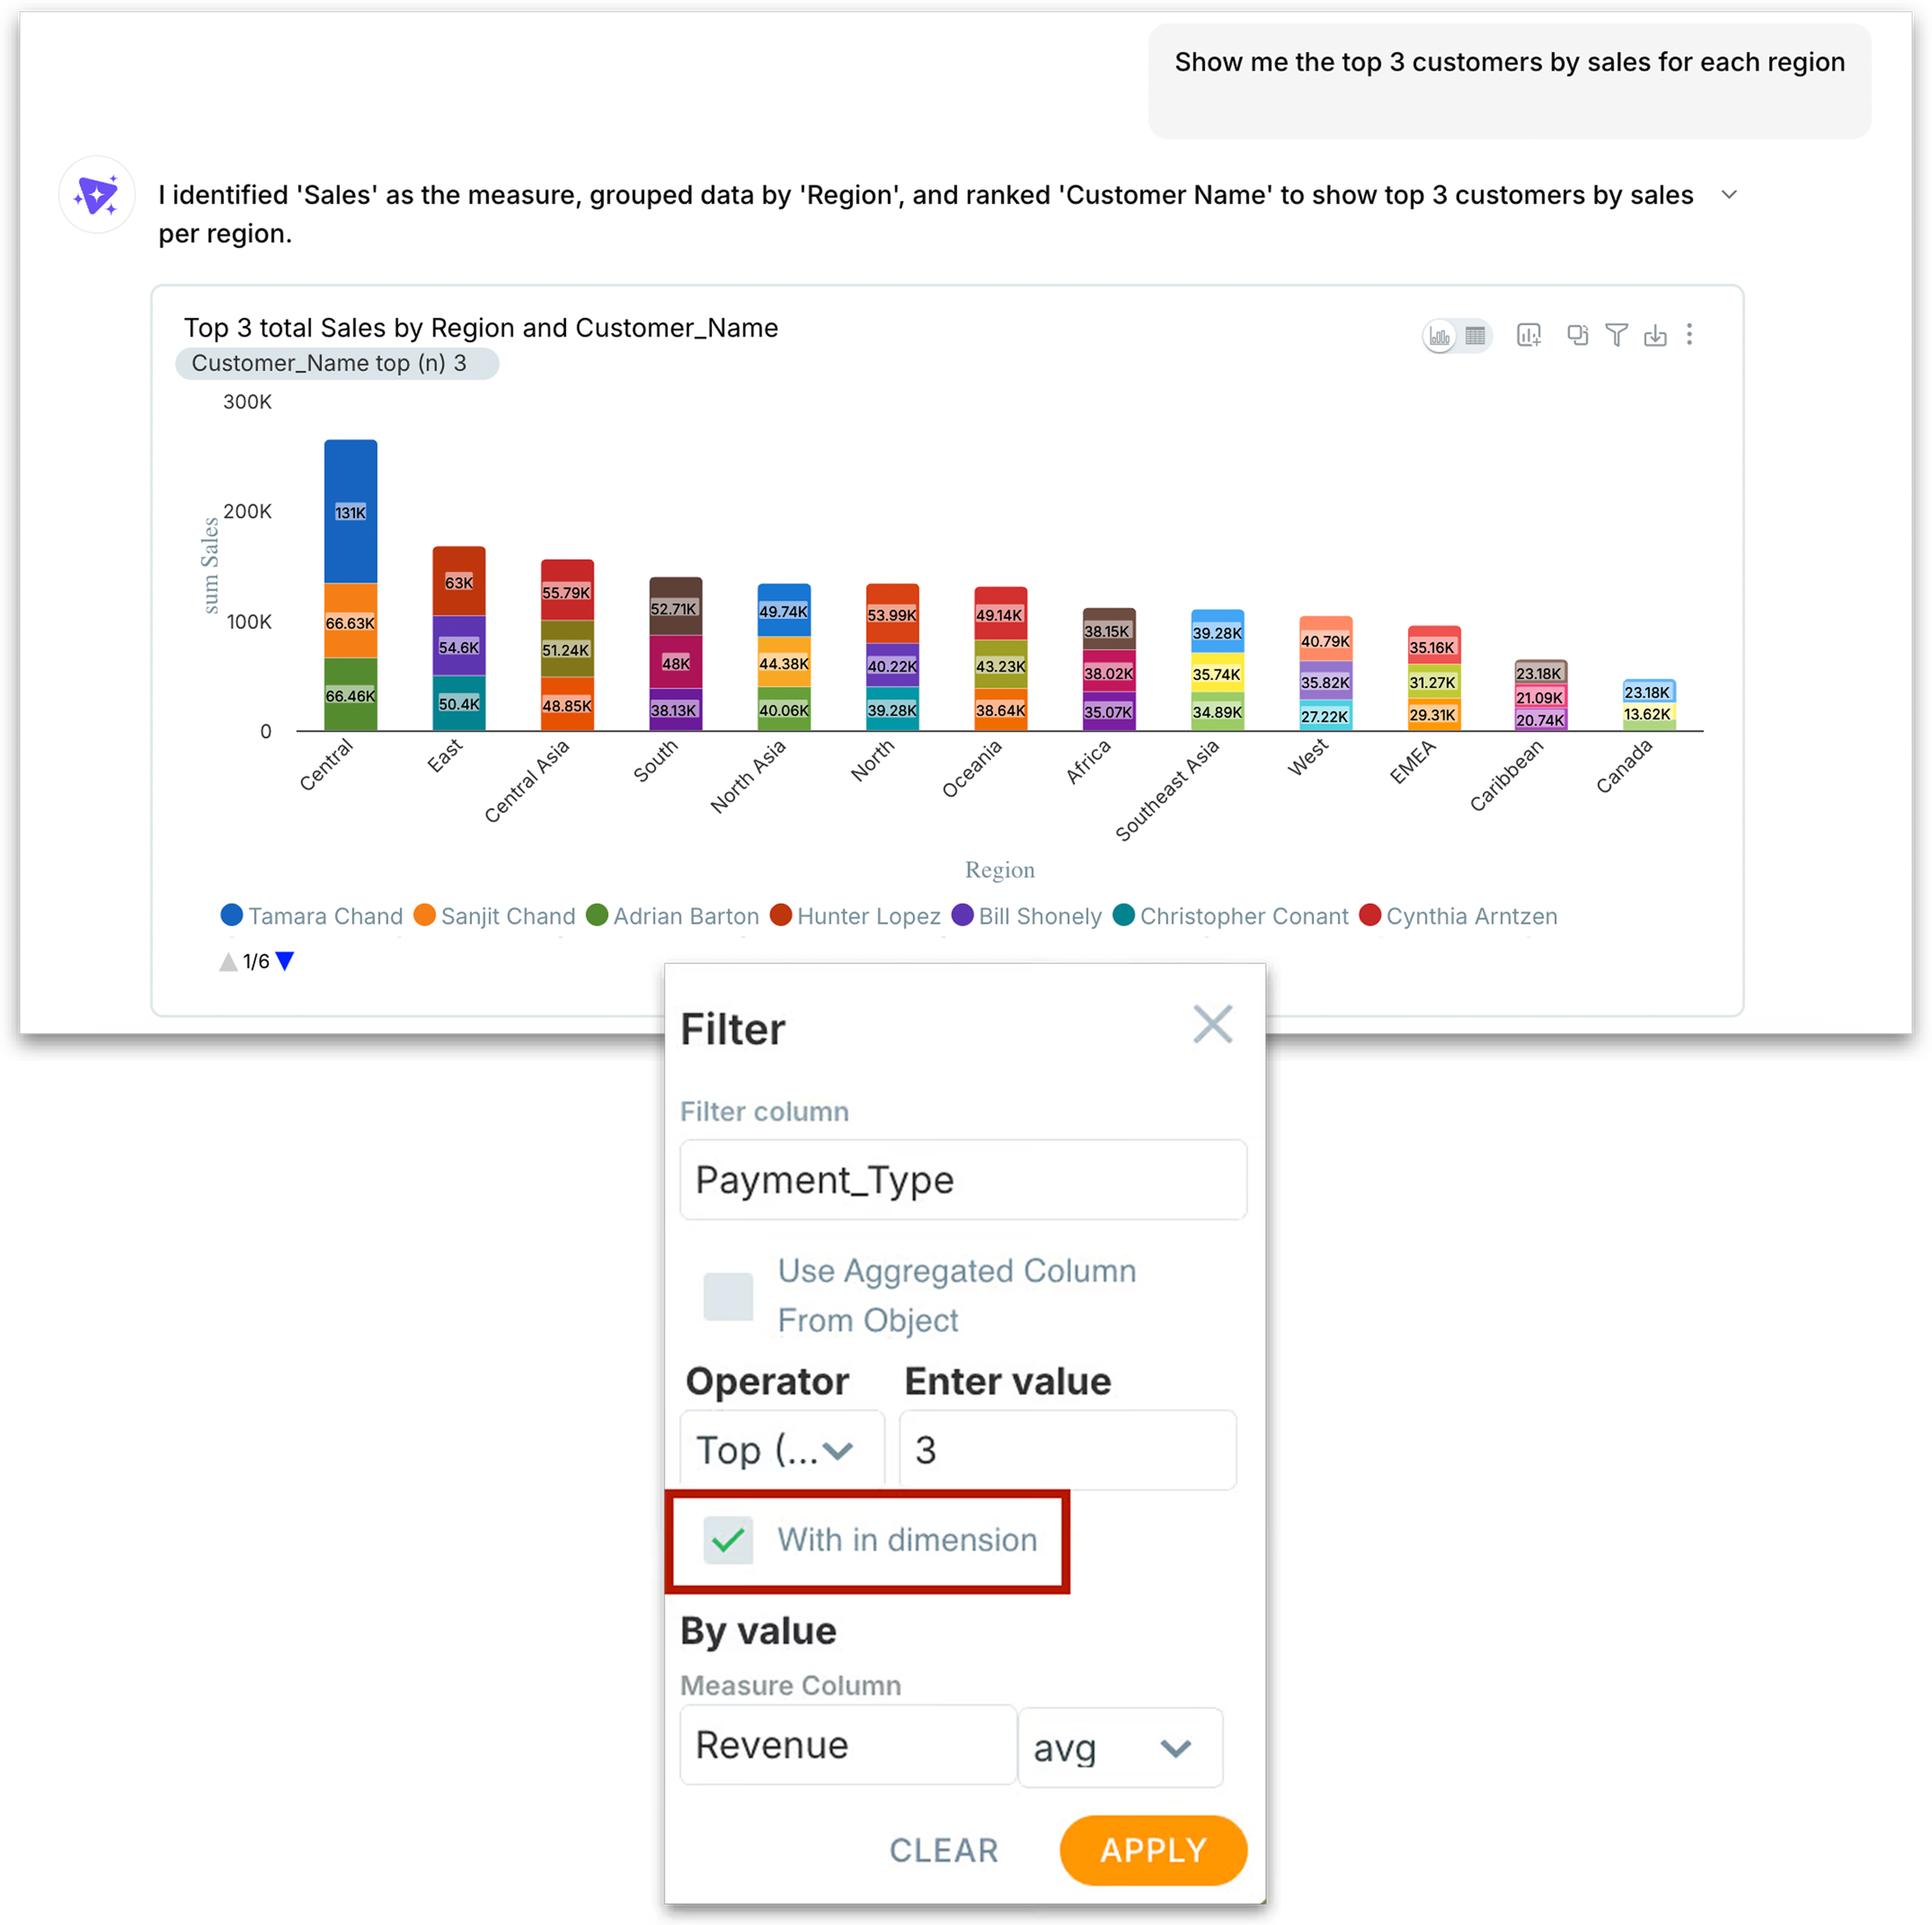
"Show top 3 performers by sales region this year"
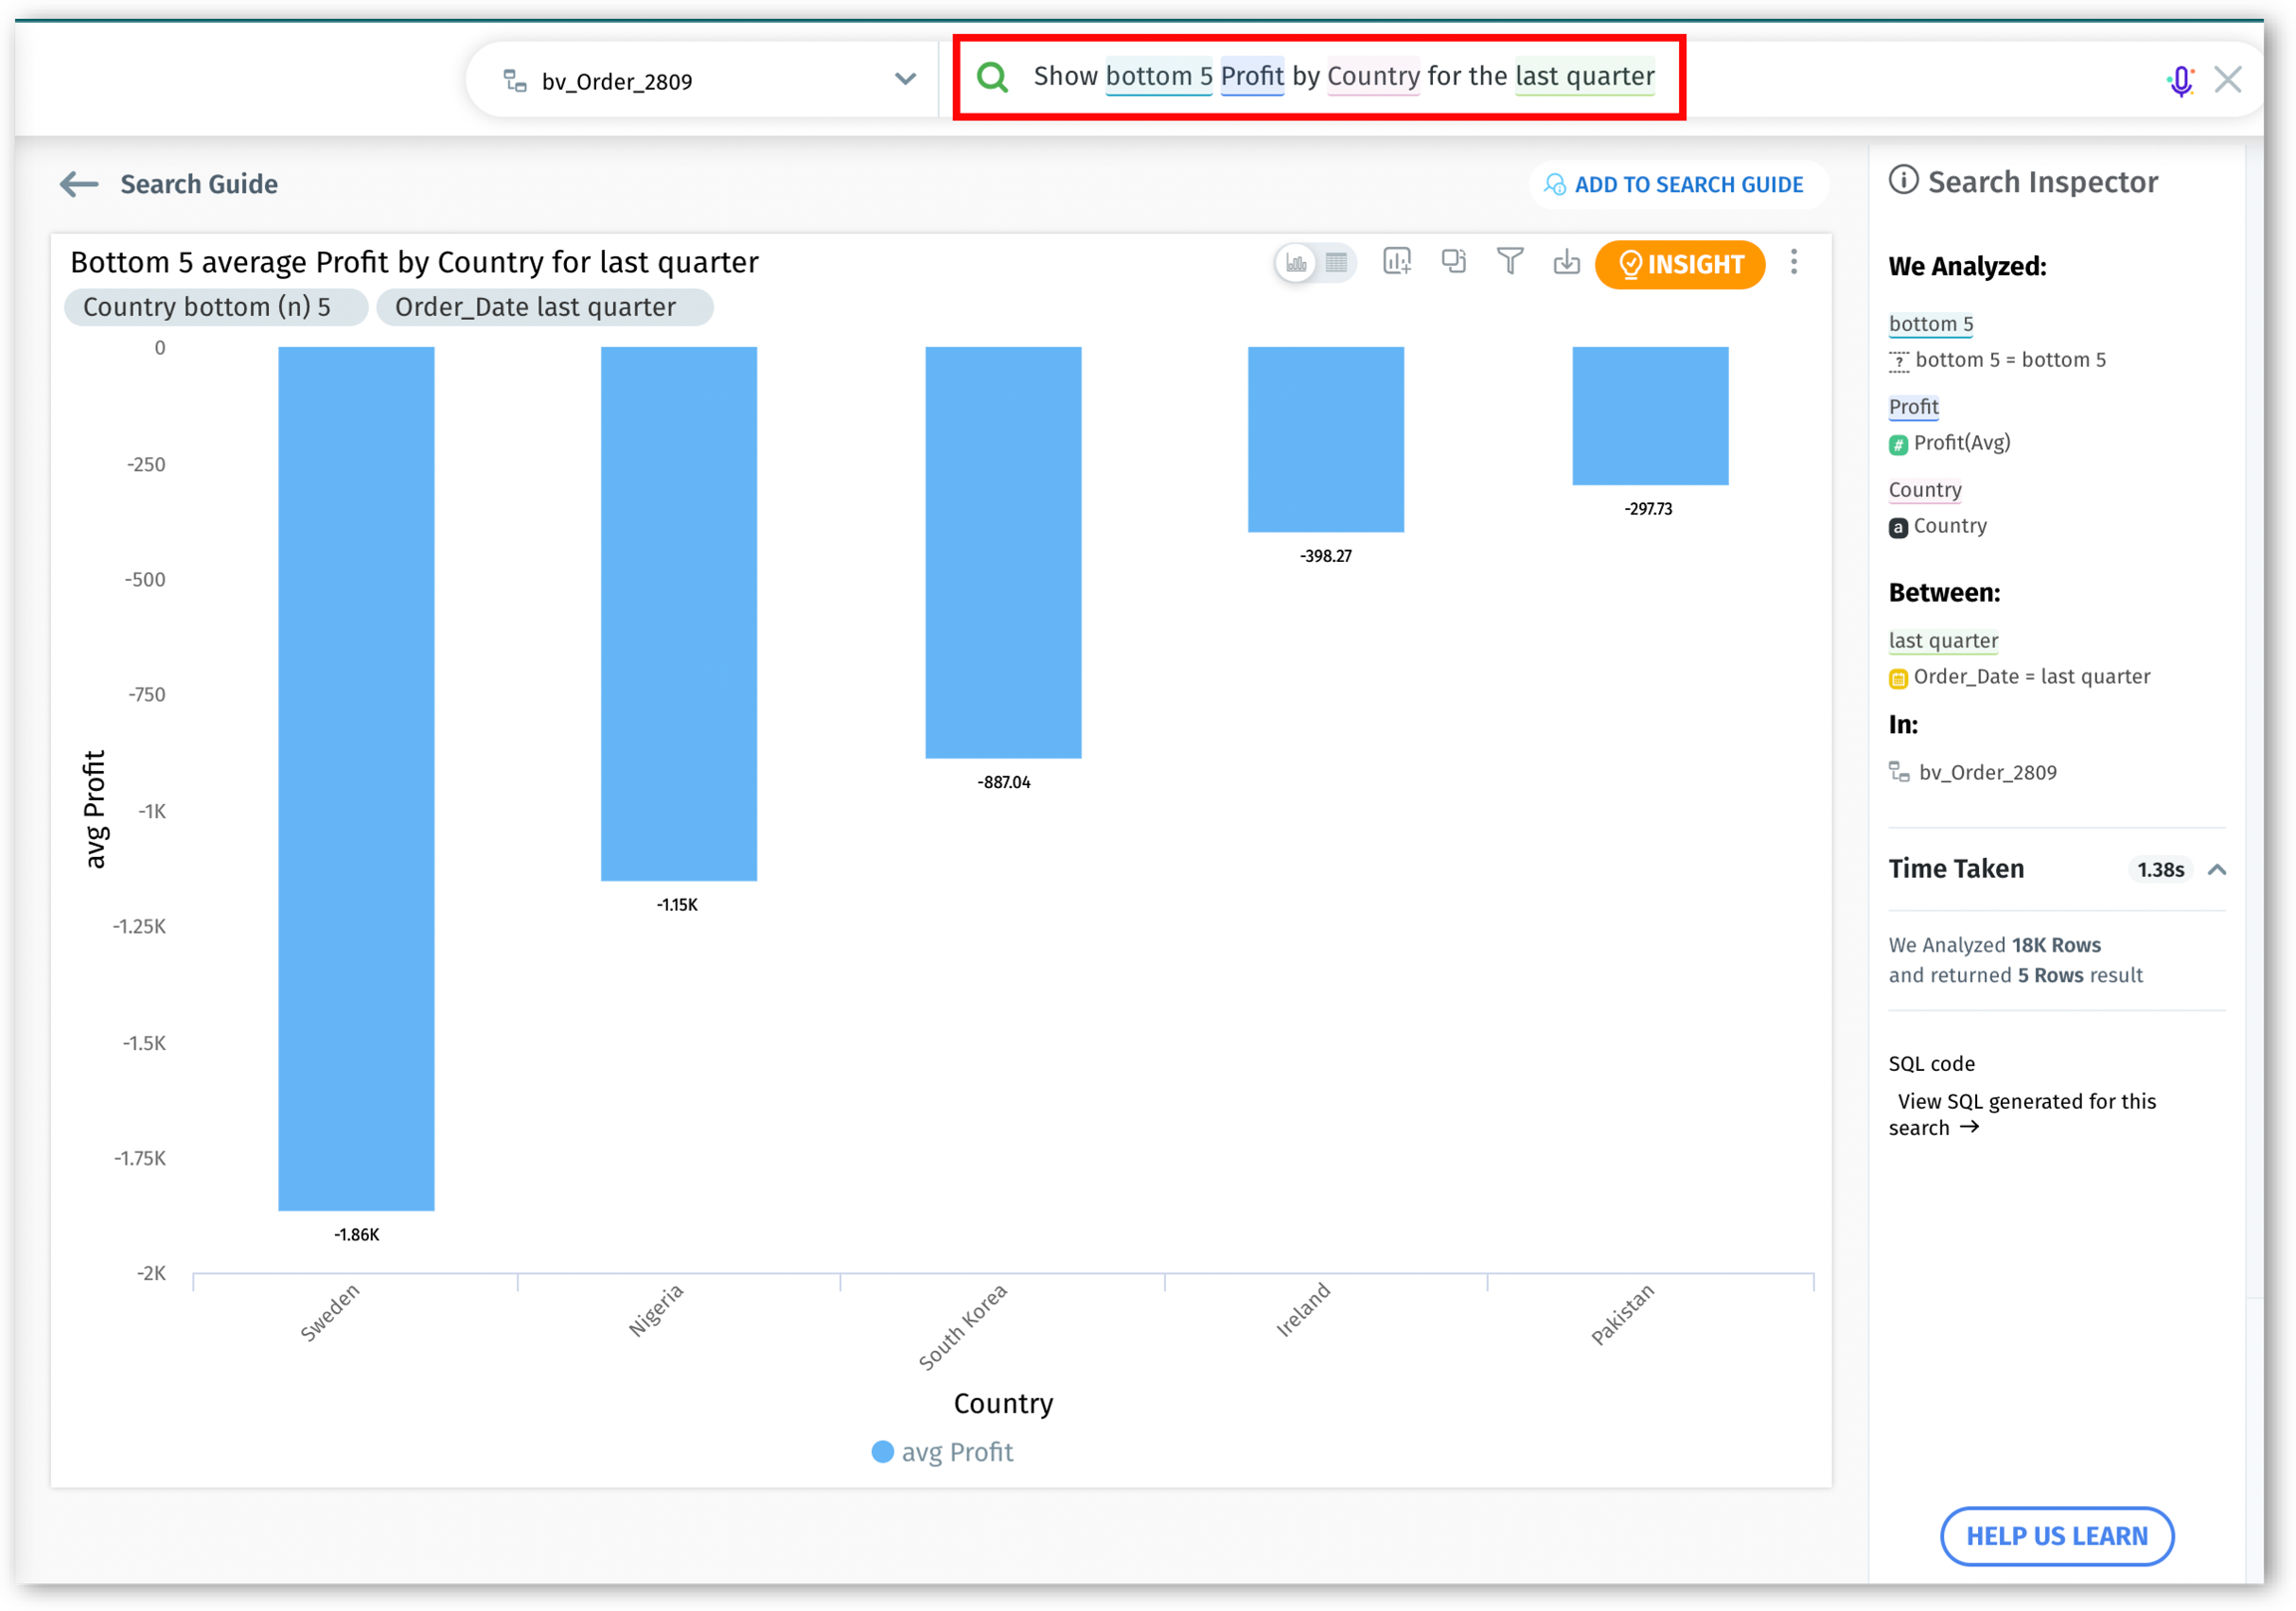
"Show bottom 5 Profit by Country for the last quarter"
Resolution
Queries that break down data into specific time intervals.
"Show total training hours completed by employees monthly"
"Show yearly progression of employee satisfaction scores across all departments"
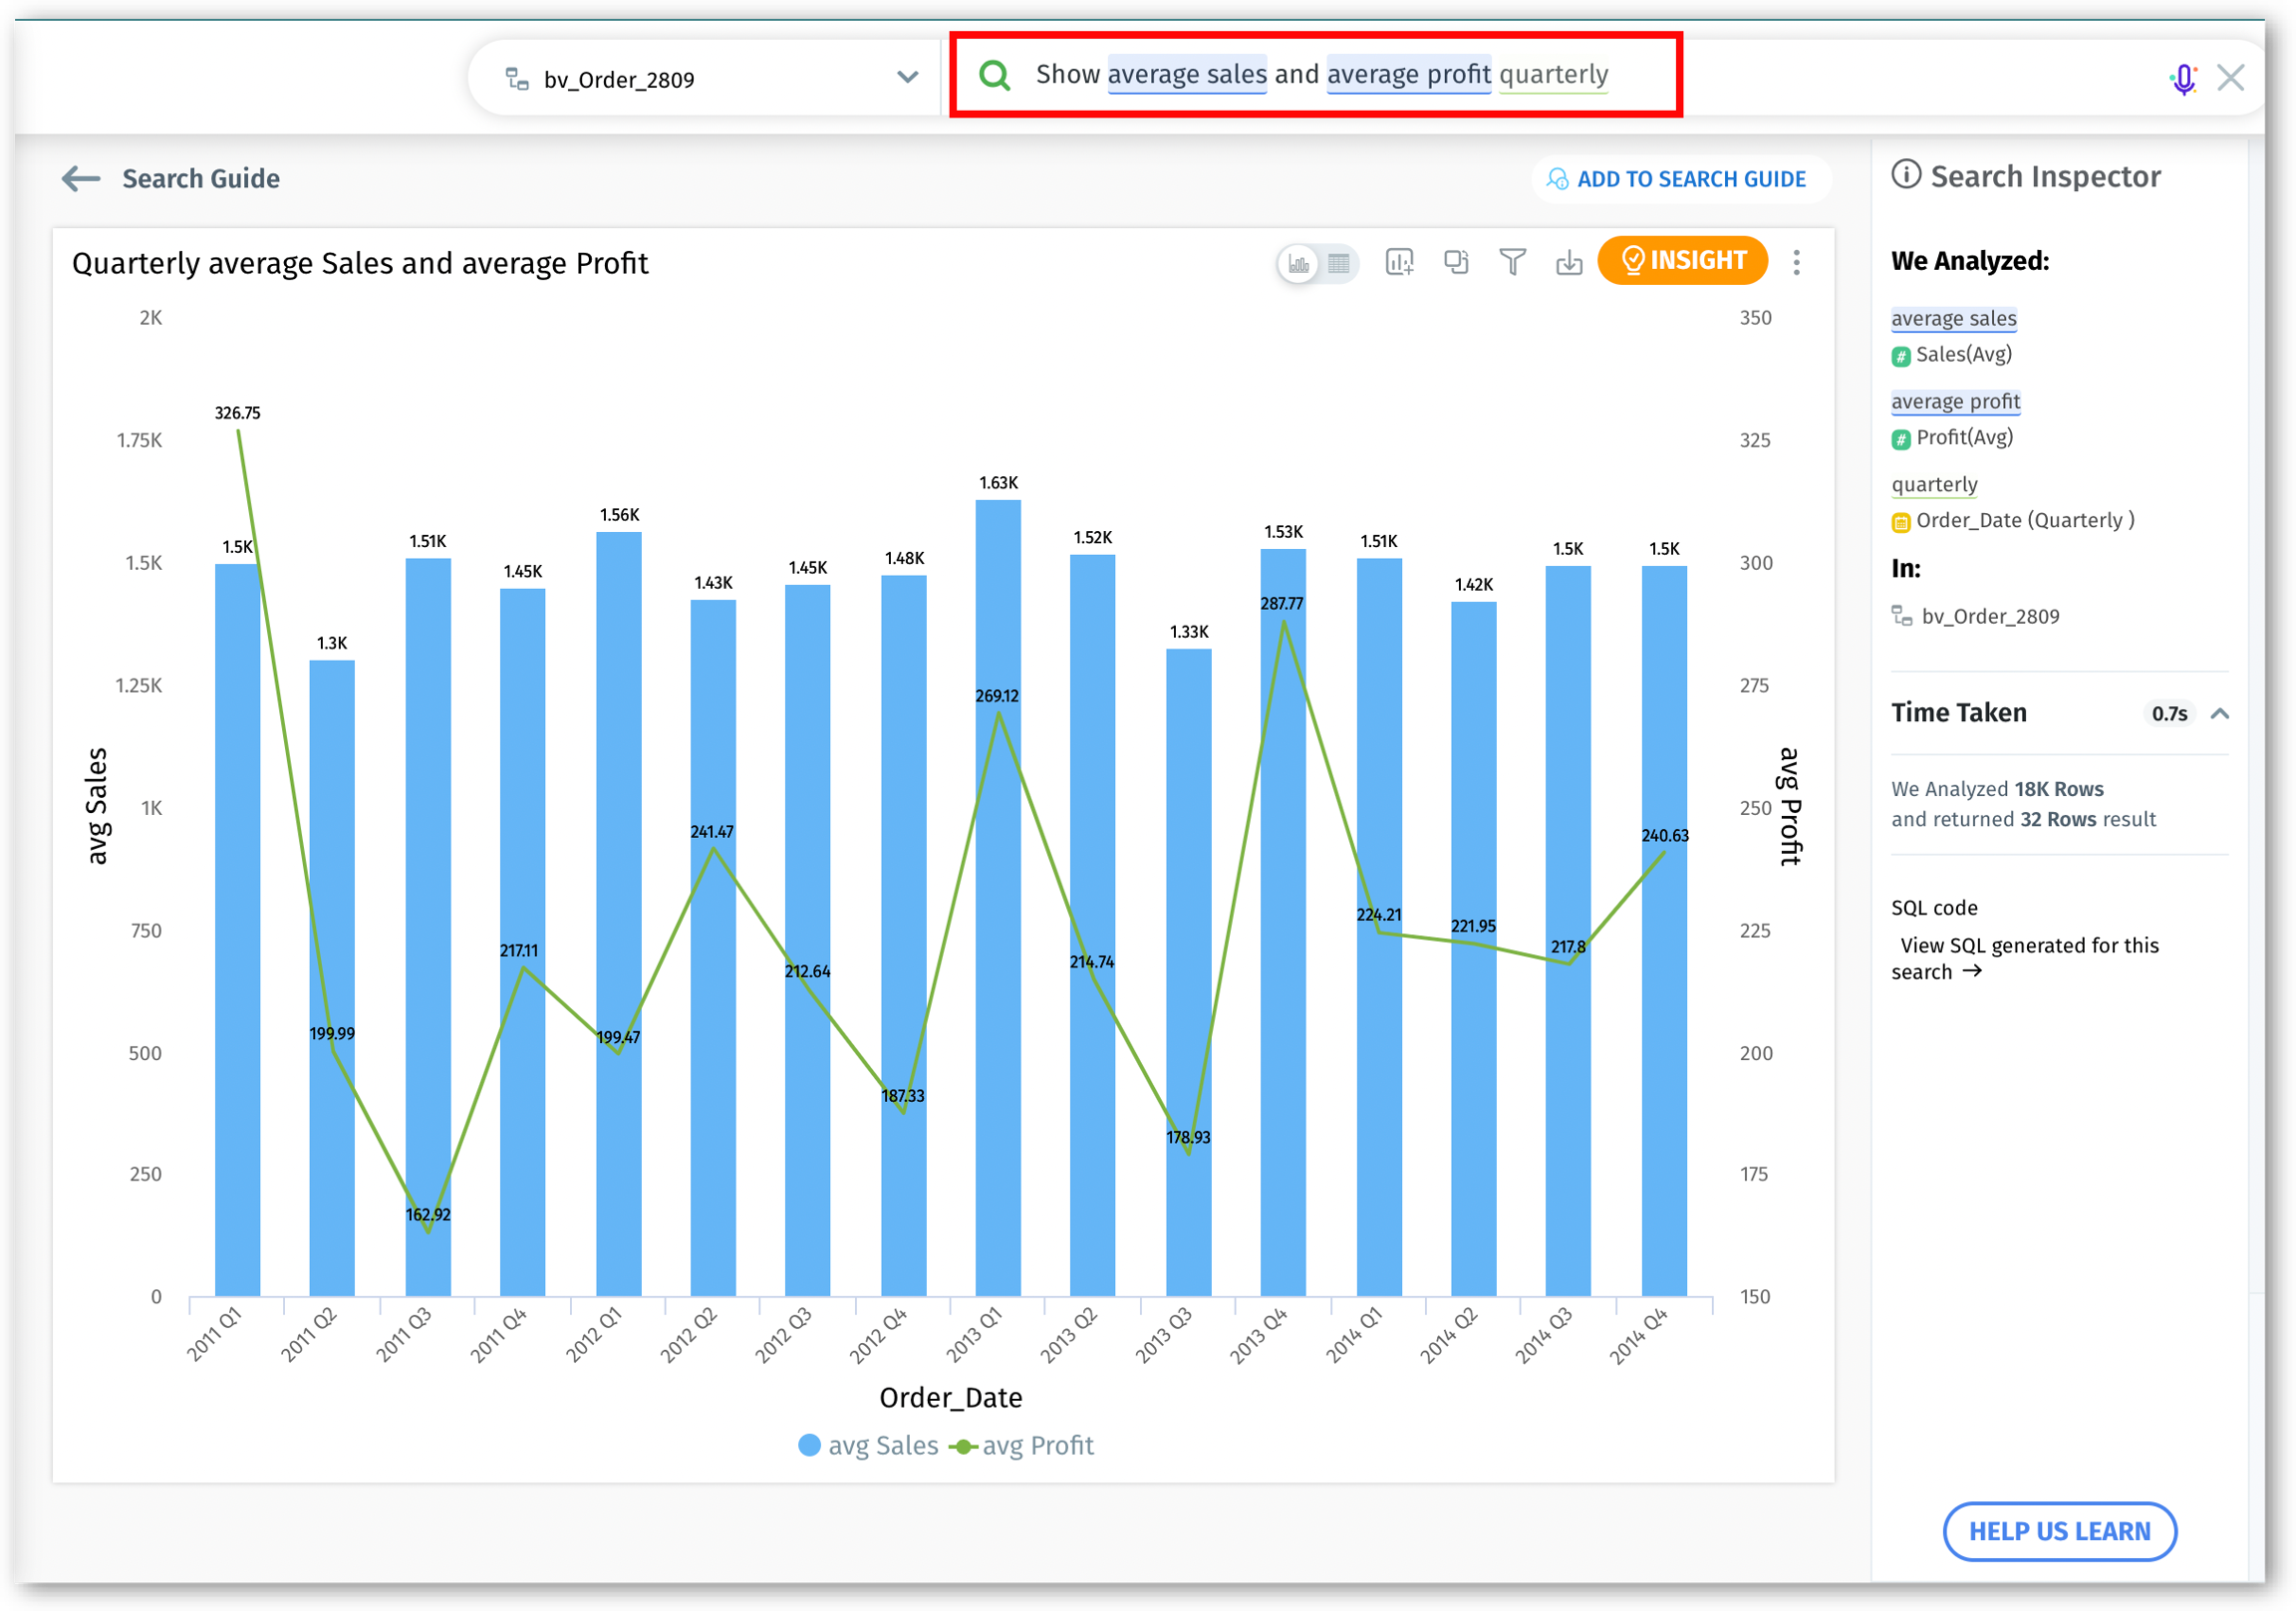
"Show average sales and average profit quarterly"
Percentages
Queries that calculate and compare data in percentage terms.
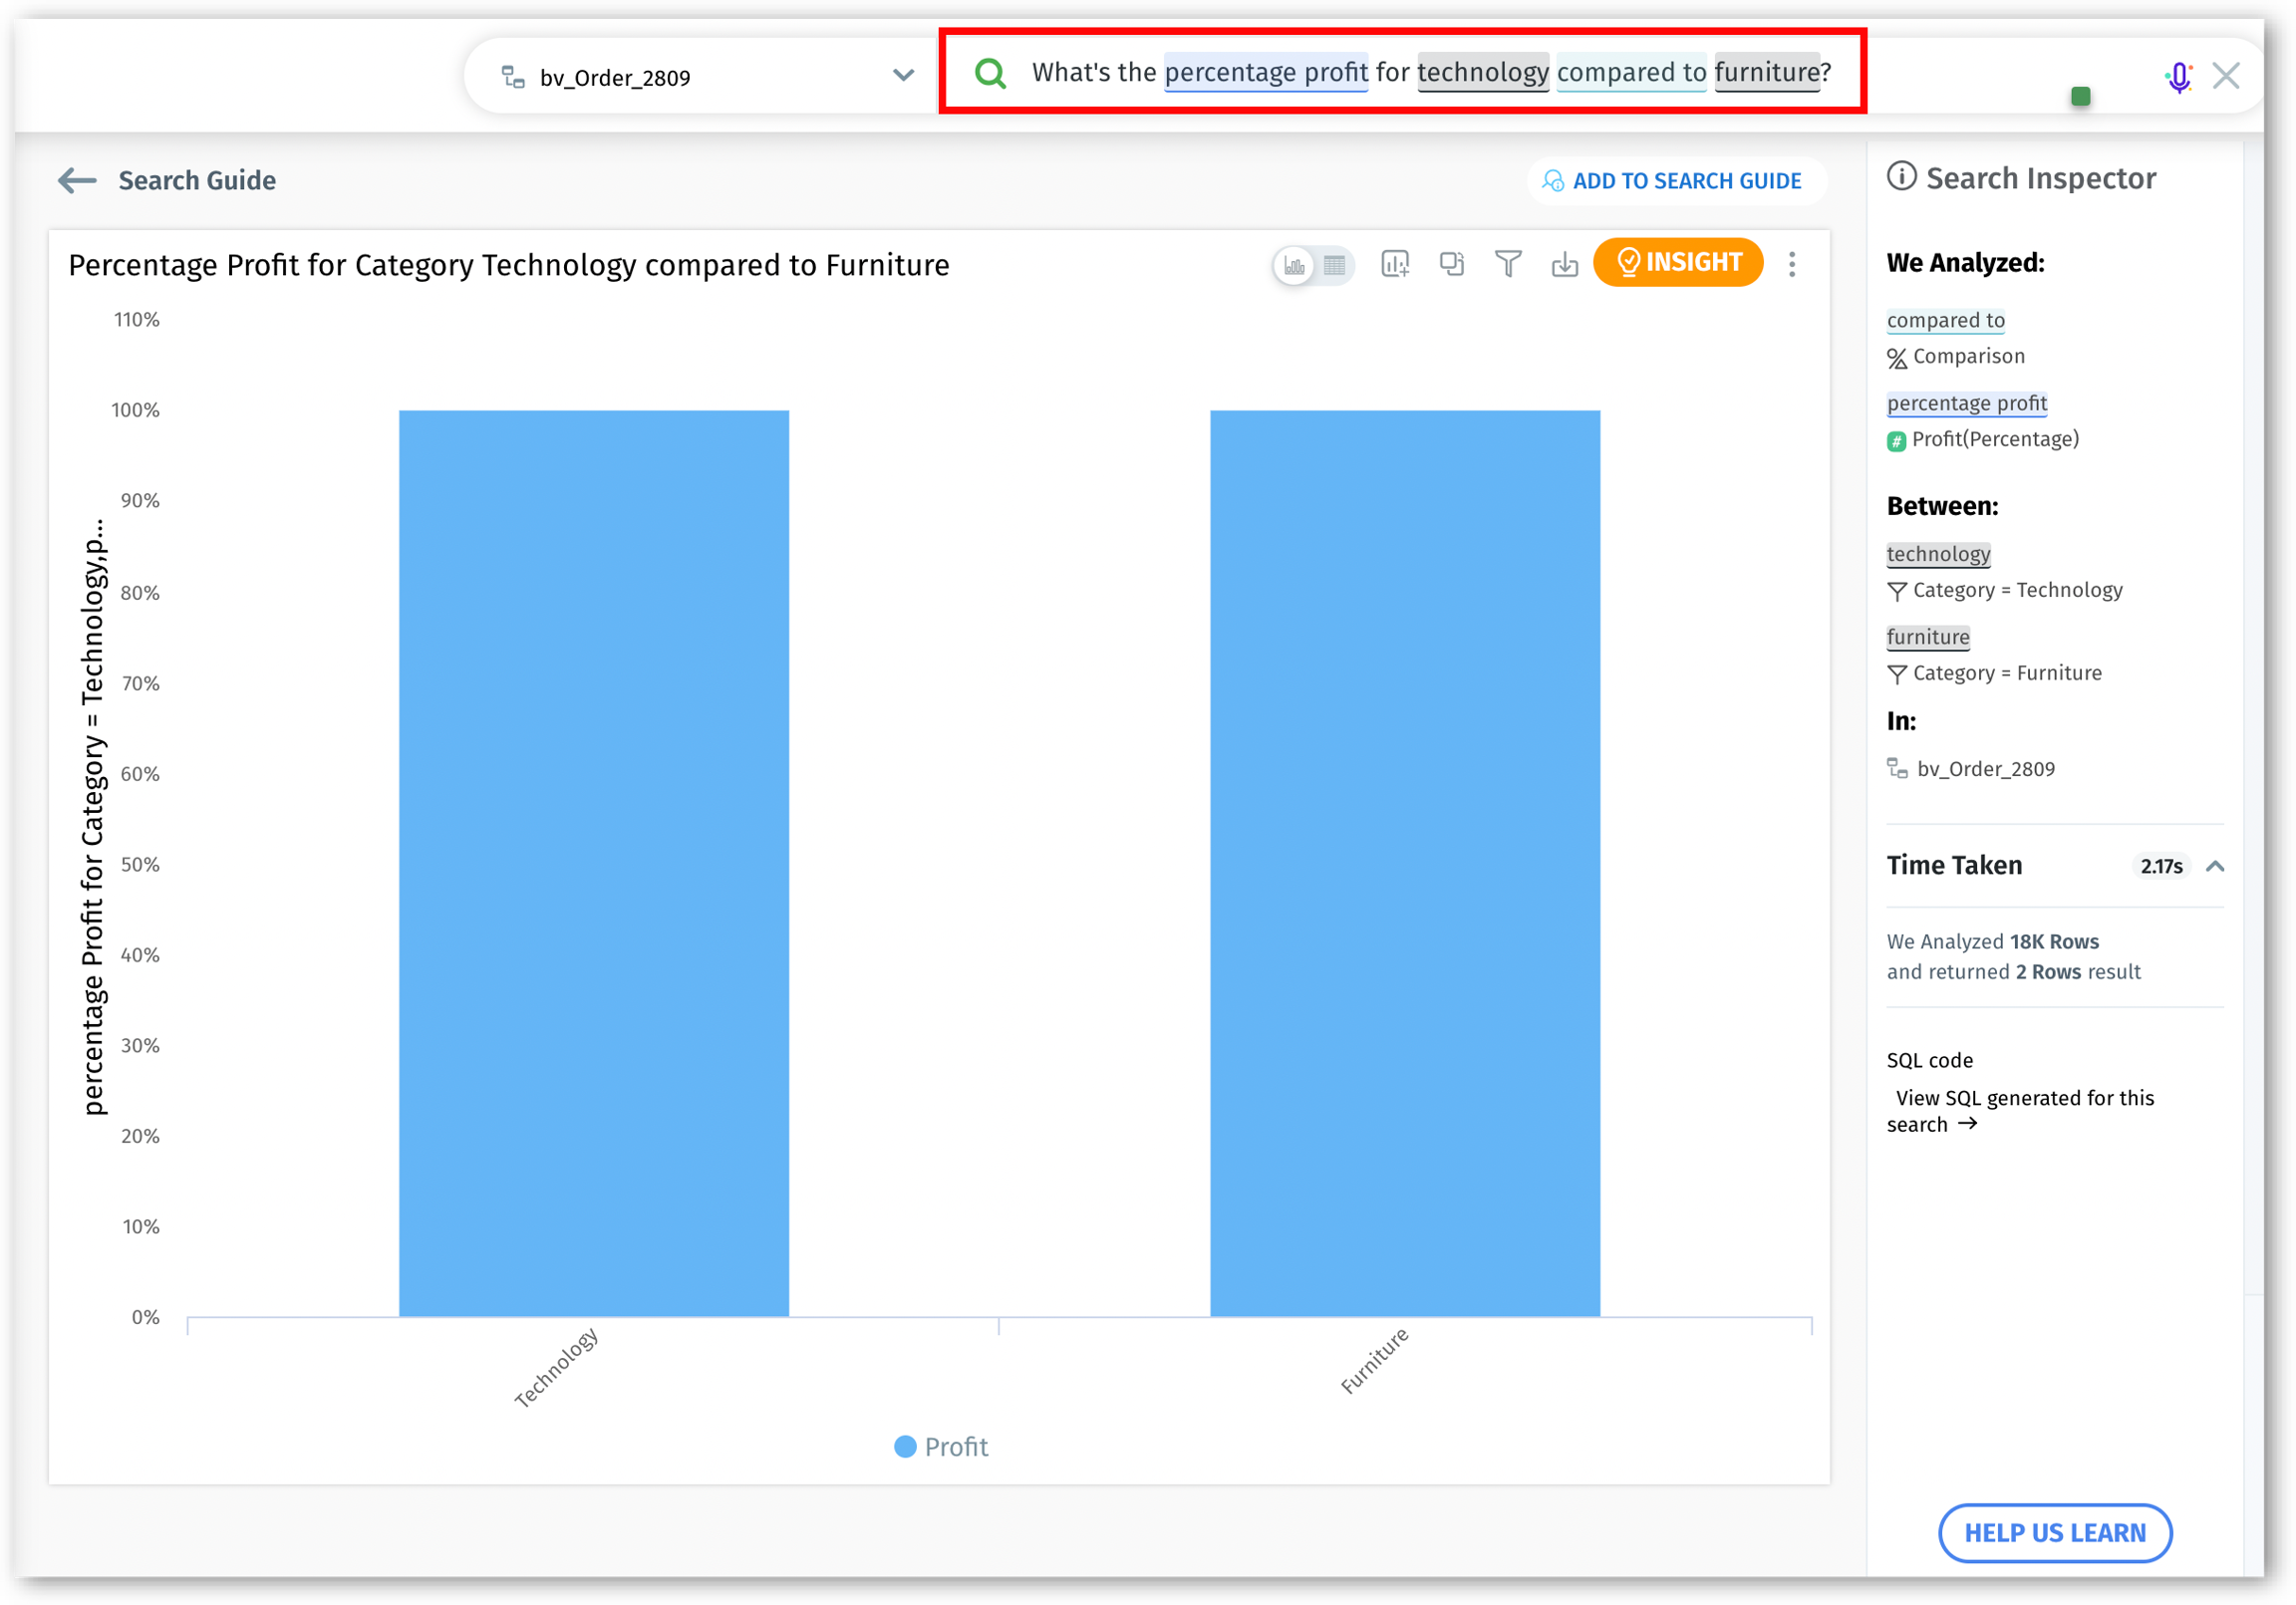
"What's the percentage profit for technology compared to furniture?"
"What is the percentage of employees meeting performance targets by department?"
"Give me the percentage profit for electronics compared to apparel for all categories"
Absolute change and Percentage change
Absolute change: This refers to the direct difference in a metric's value between two time periods, not considering the size of the initial value. It is useful for understanding the exact increase or decrease in a metric.
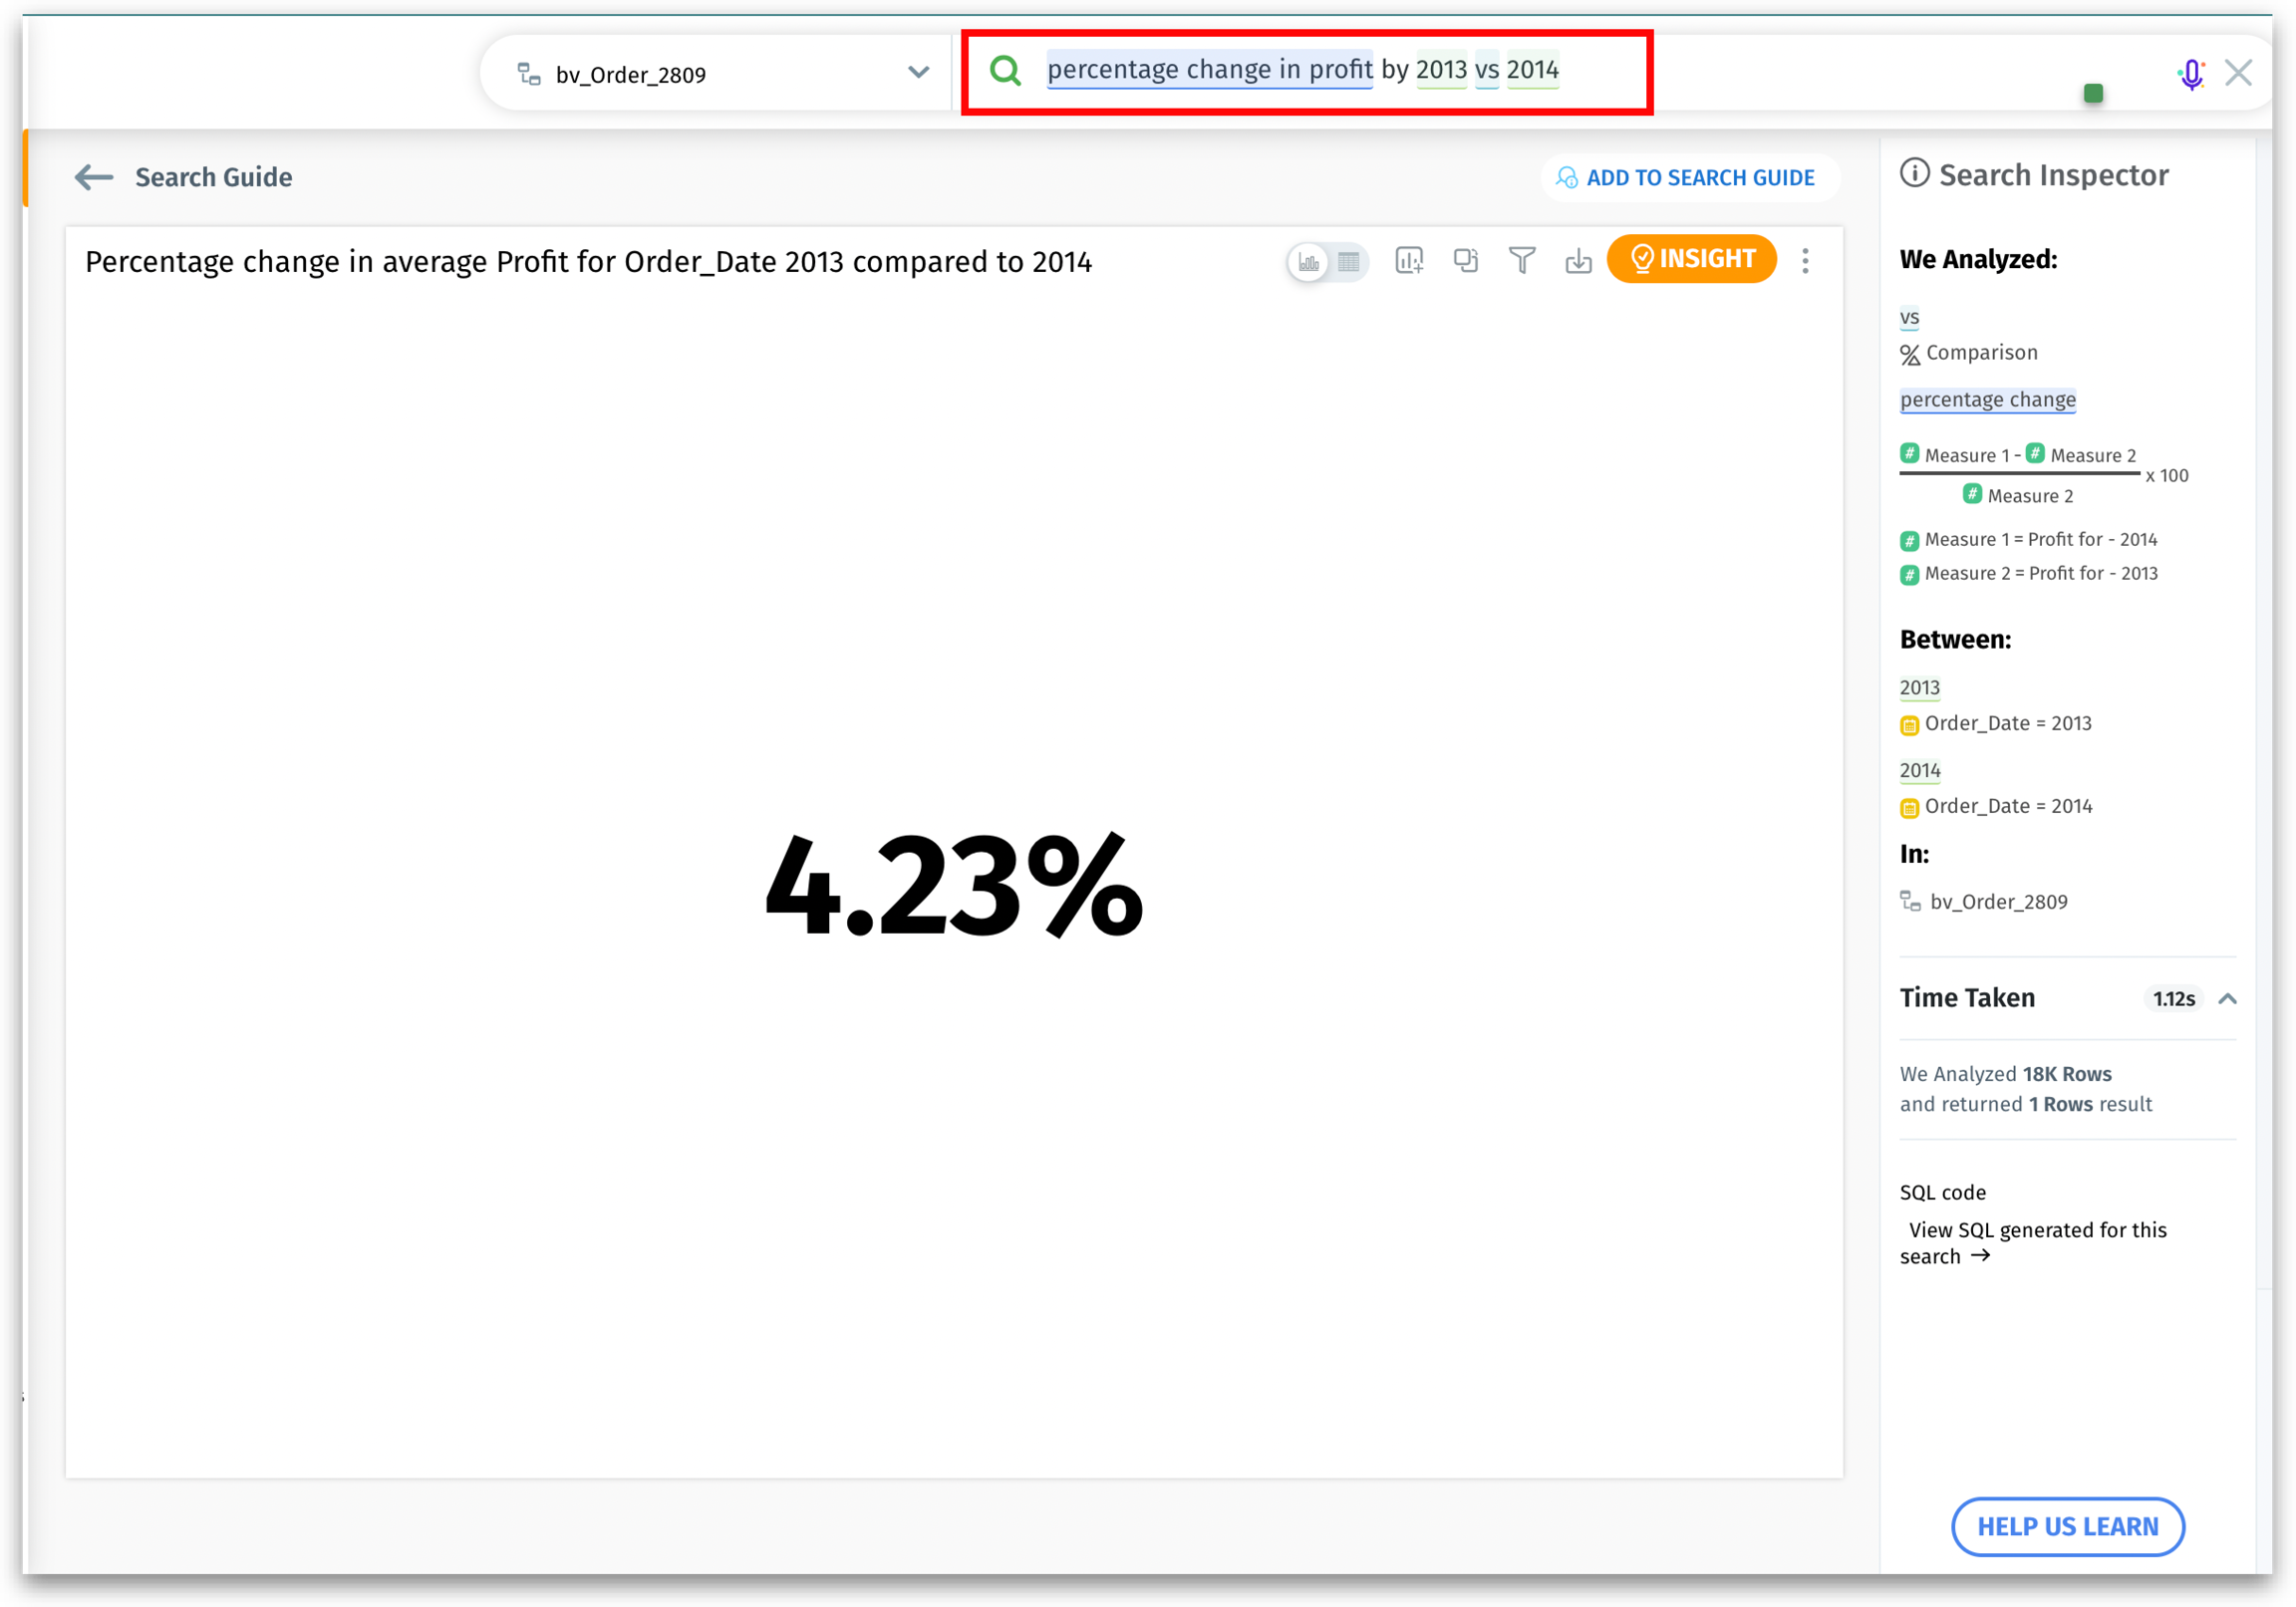
Percentage change: In contrast, percentage change provides the proportional change in a metric, relative to its original value. It's expressed as a percentage, offering a sense of the scale or significance of the change, especially in relation to the starting point.
"What is the percentage change in annual employee satisfaction scores from 2020 to 2023?"
"Show the percentage change in the number of new hires in the Sales department in 2019 vs 2023"
"Absolute change in customer support tickets resolved in 24 hours"
Time-Based
Queries focusing on data related to specific time frames.
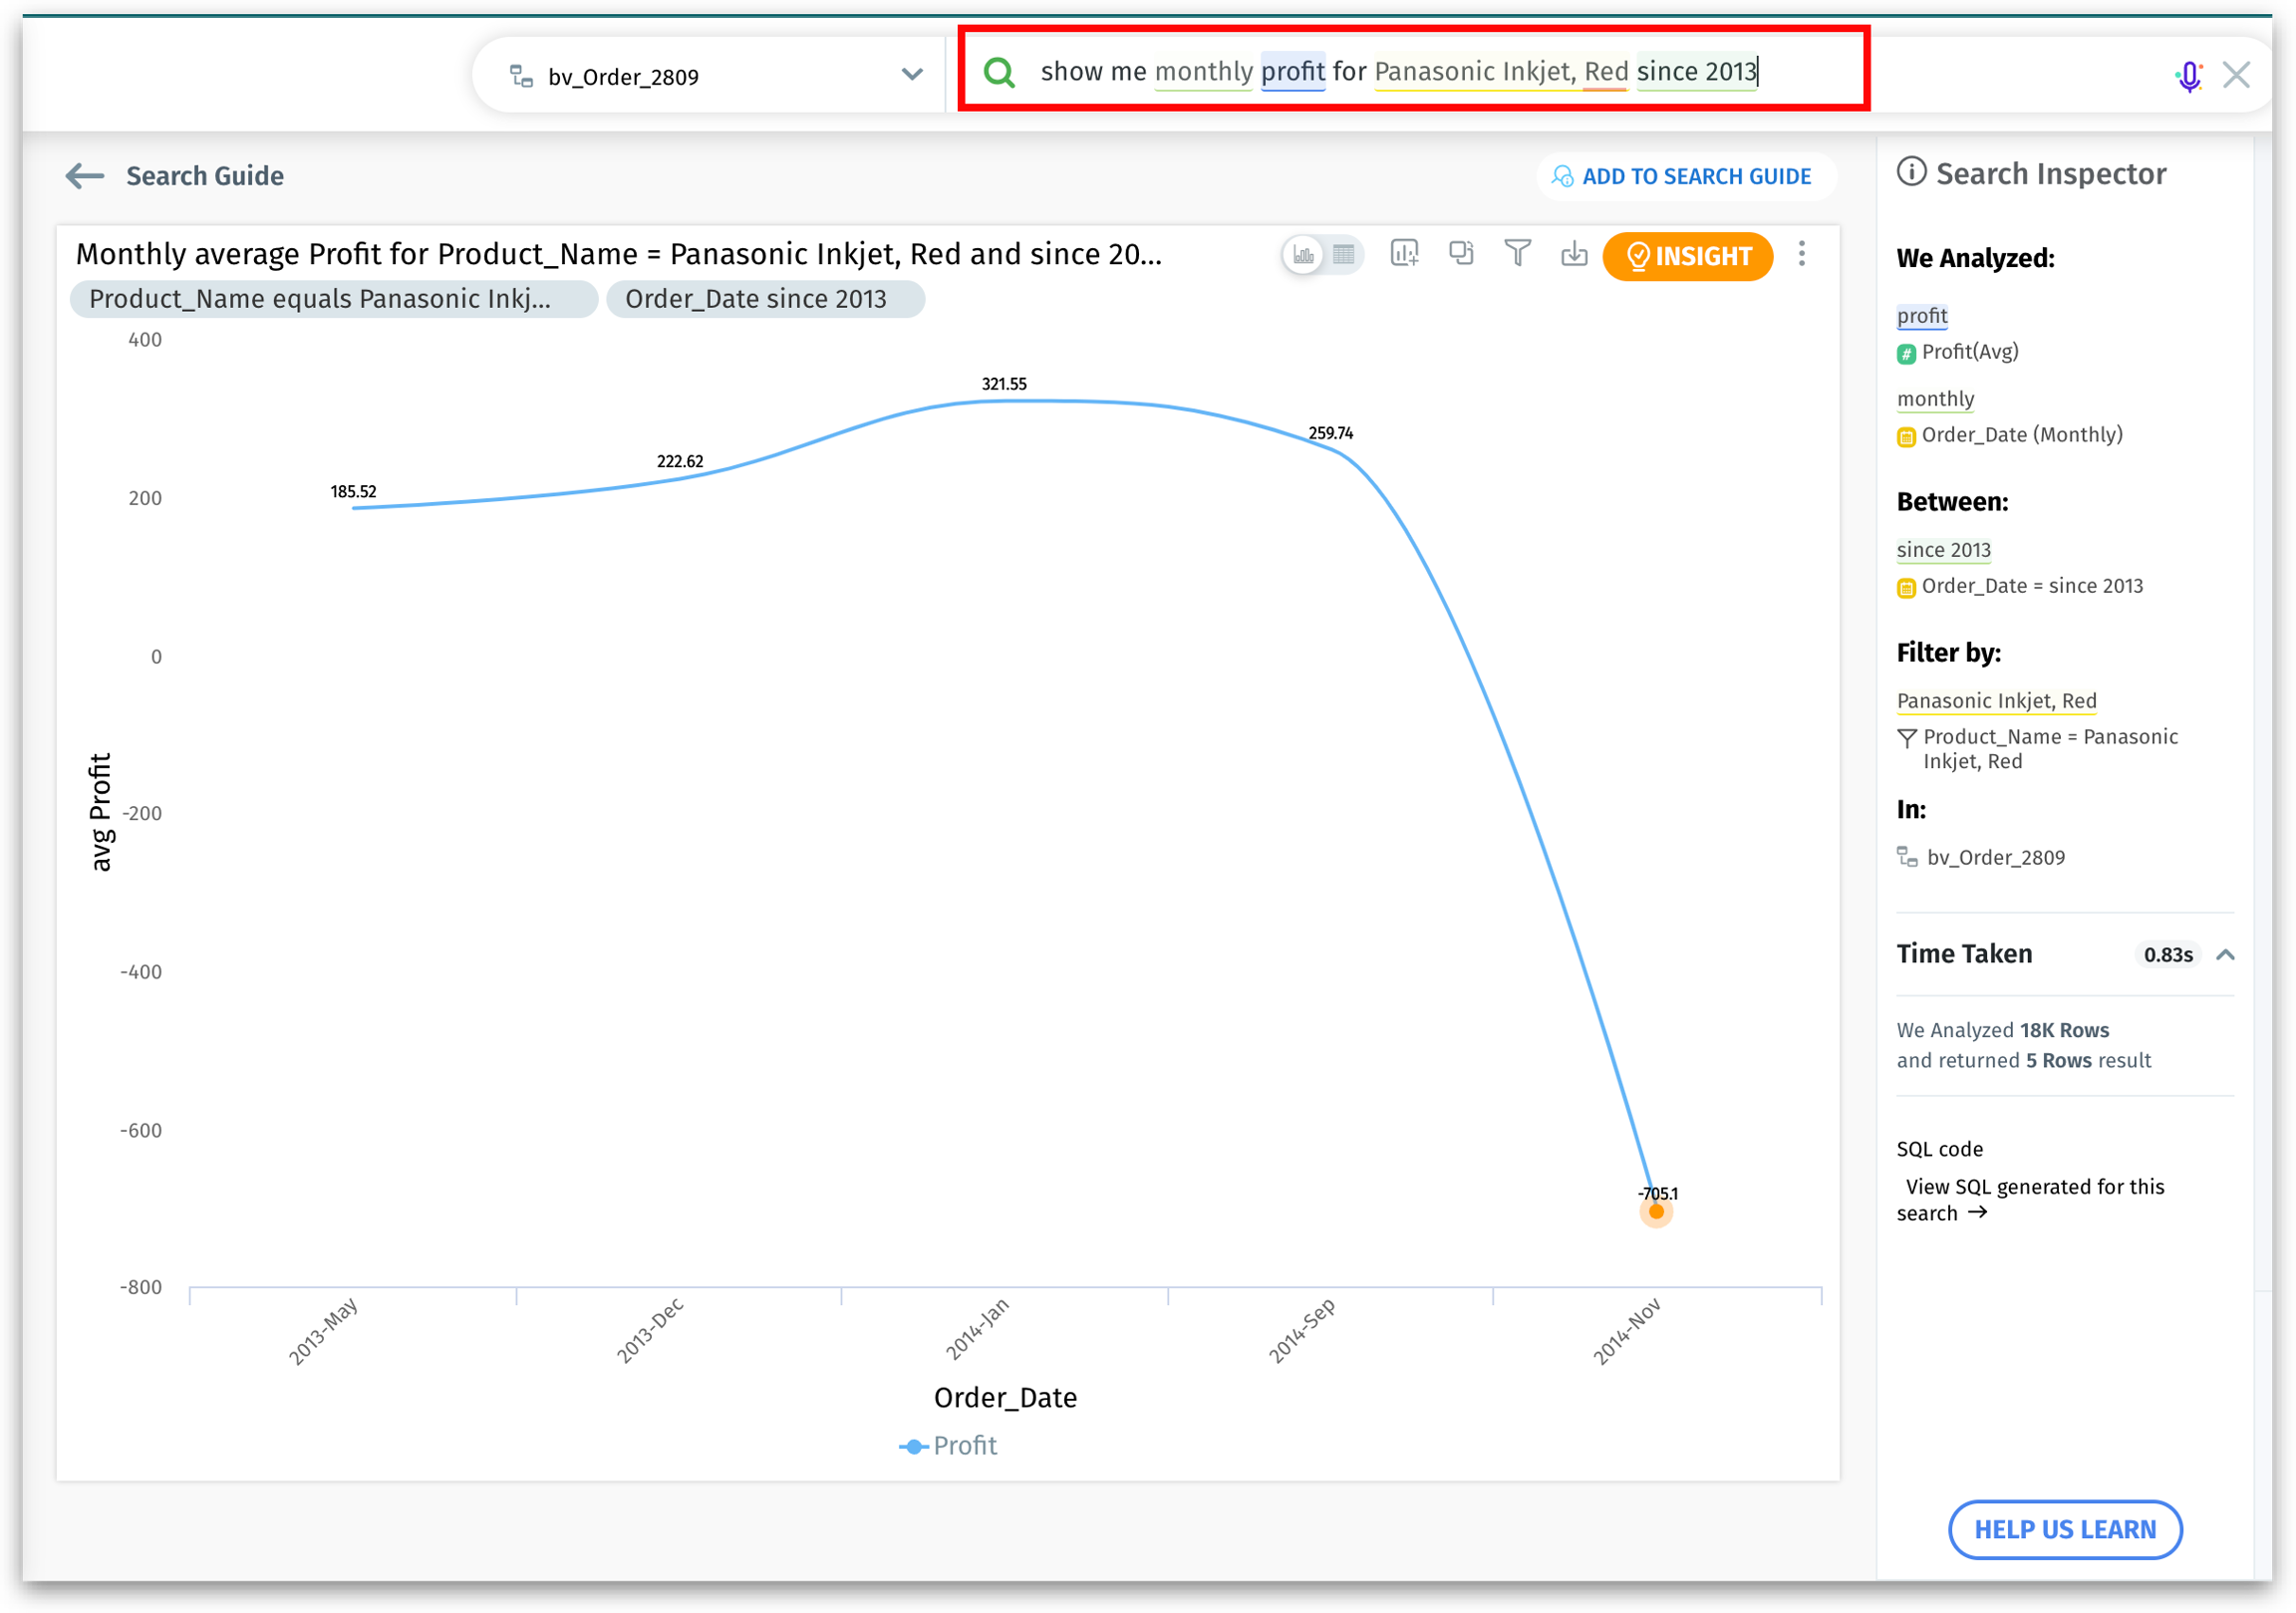
"Show me the total Profit for 2022"
"Show the total helpdesk tickets resolved in January 2022"
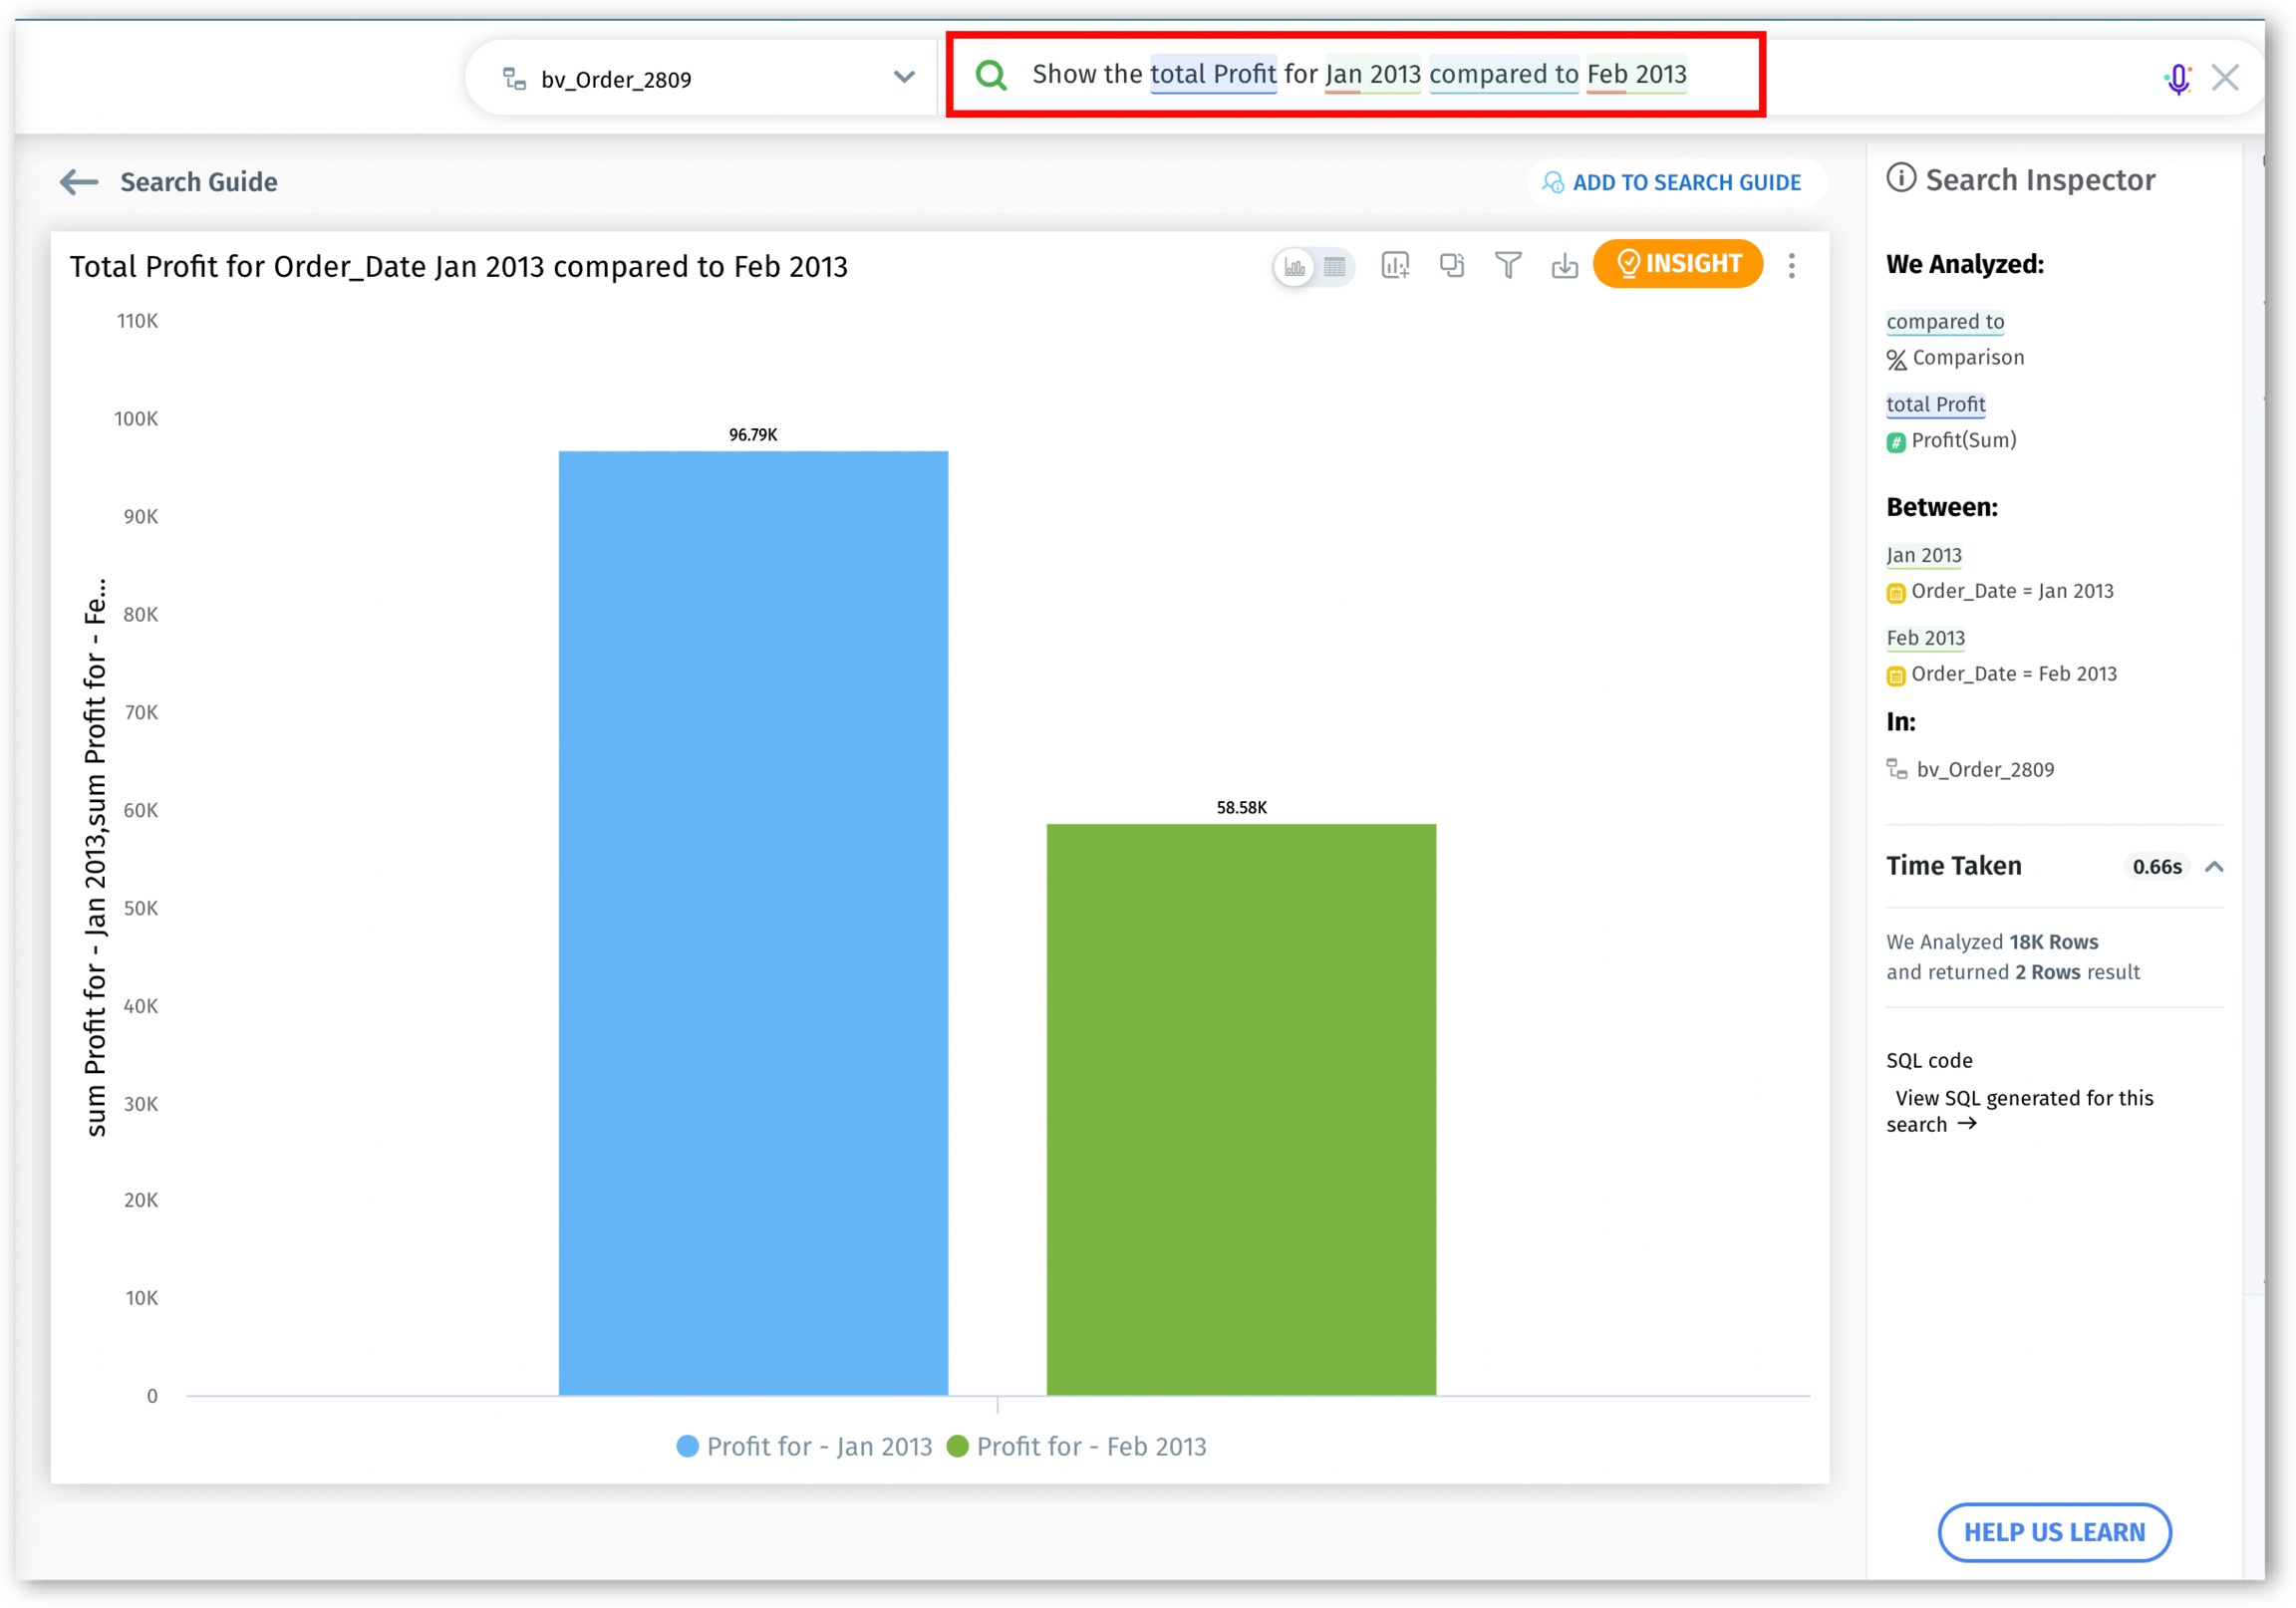
"Show total cybersecurity incidents reported in Q2 2022 compared to Q2 2023"
Contains
Queries that filter data based on the presence of specific terms or phrases.
"Show total discount by region for suppliers containing Global"
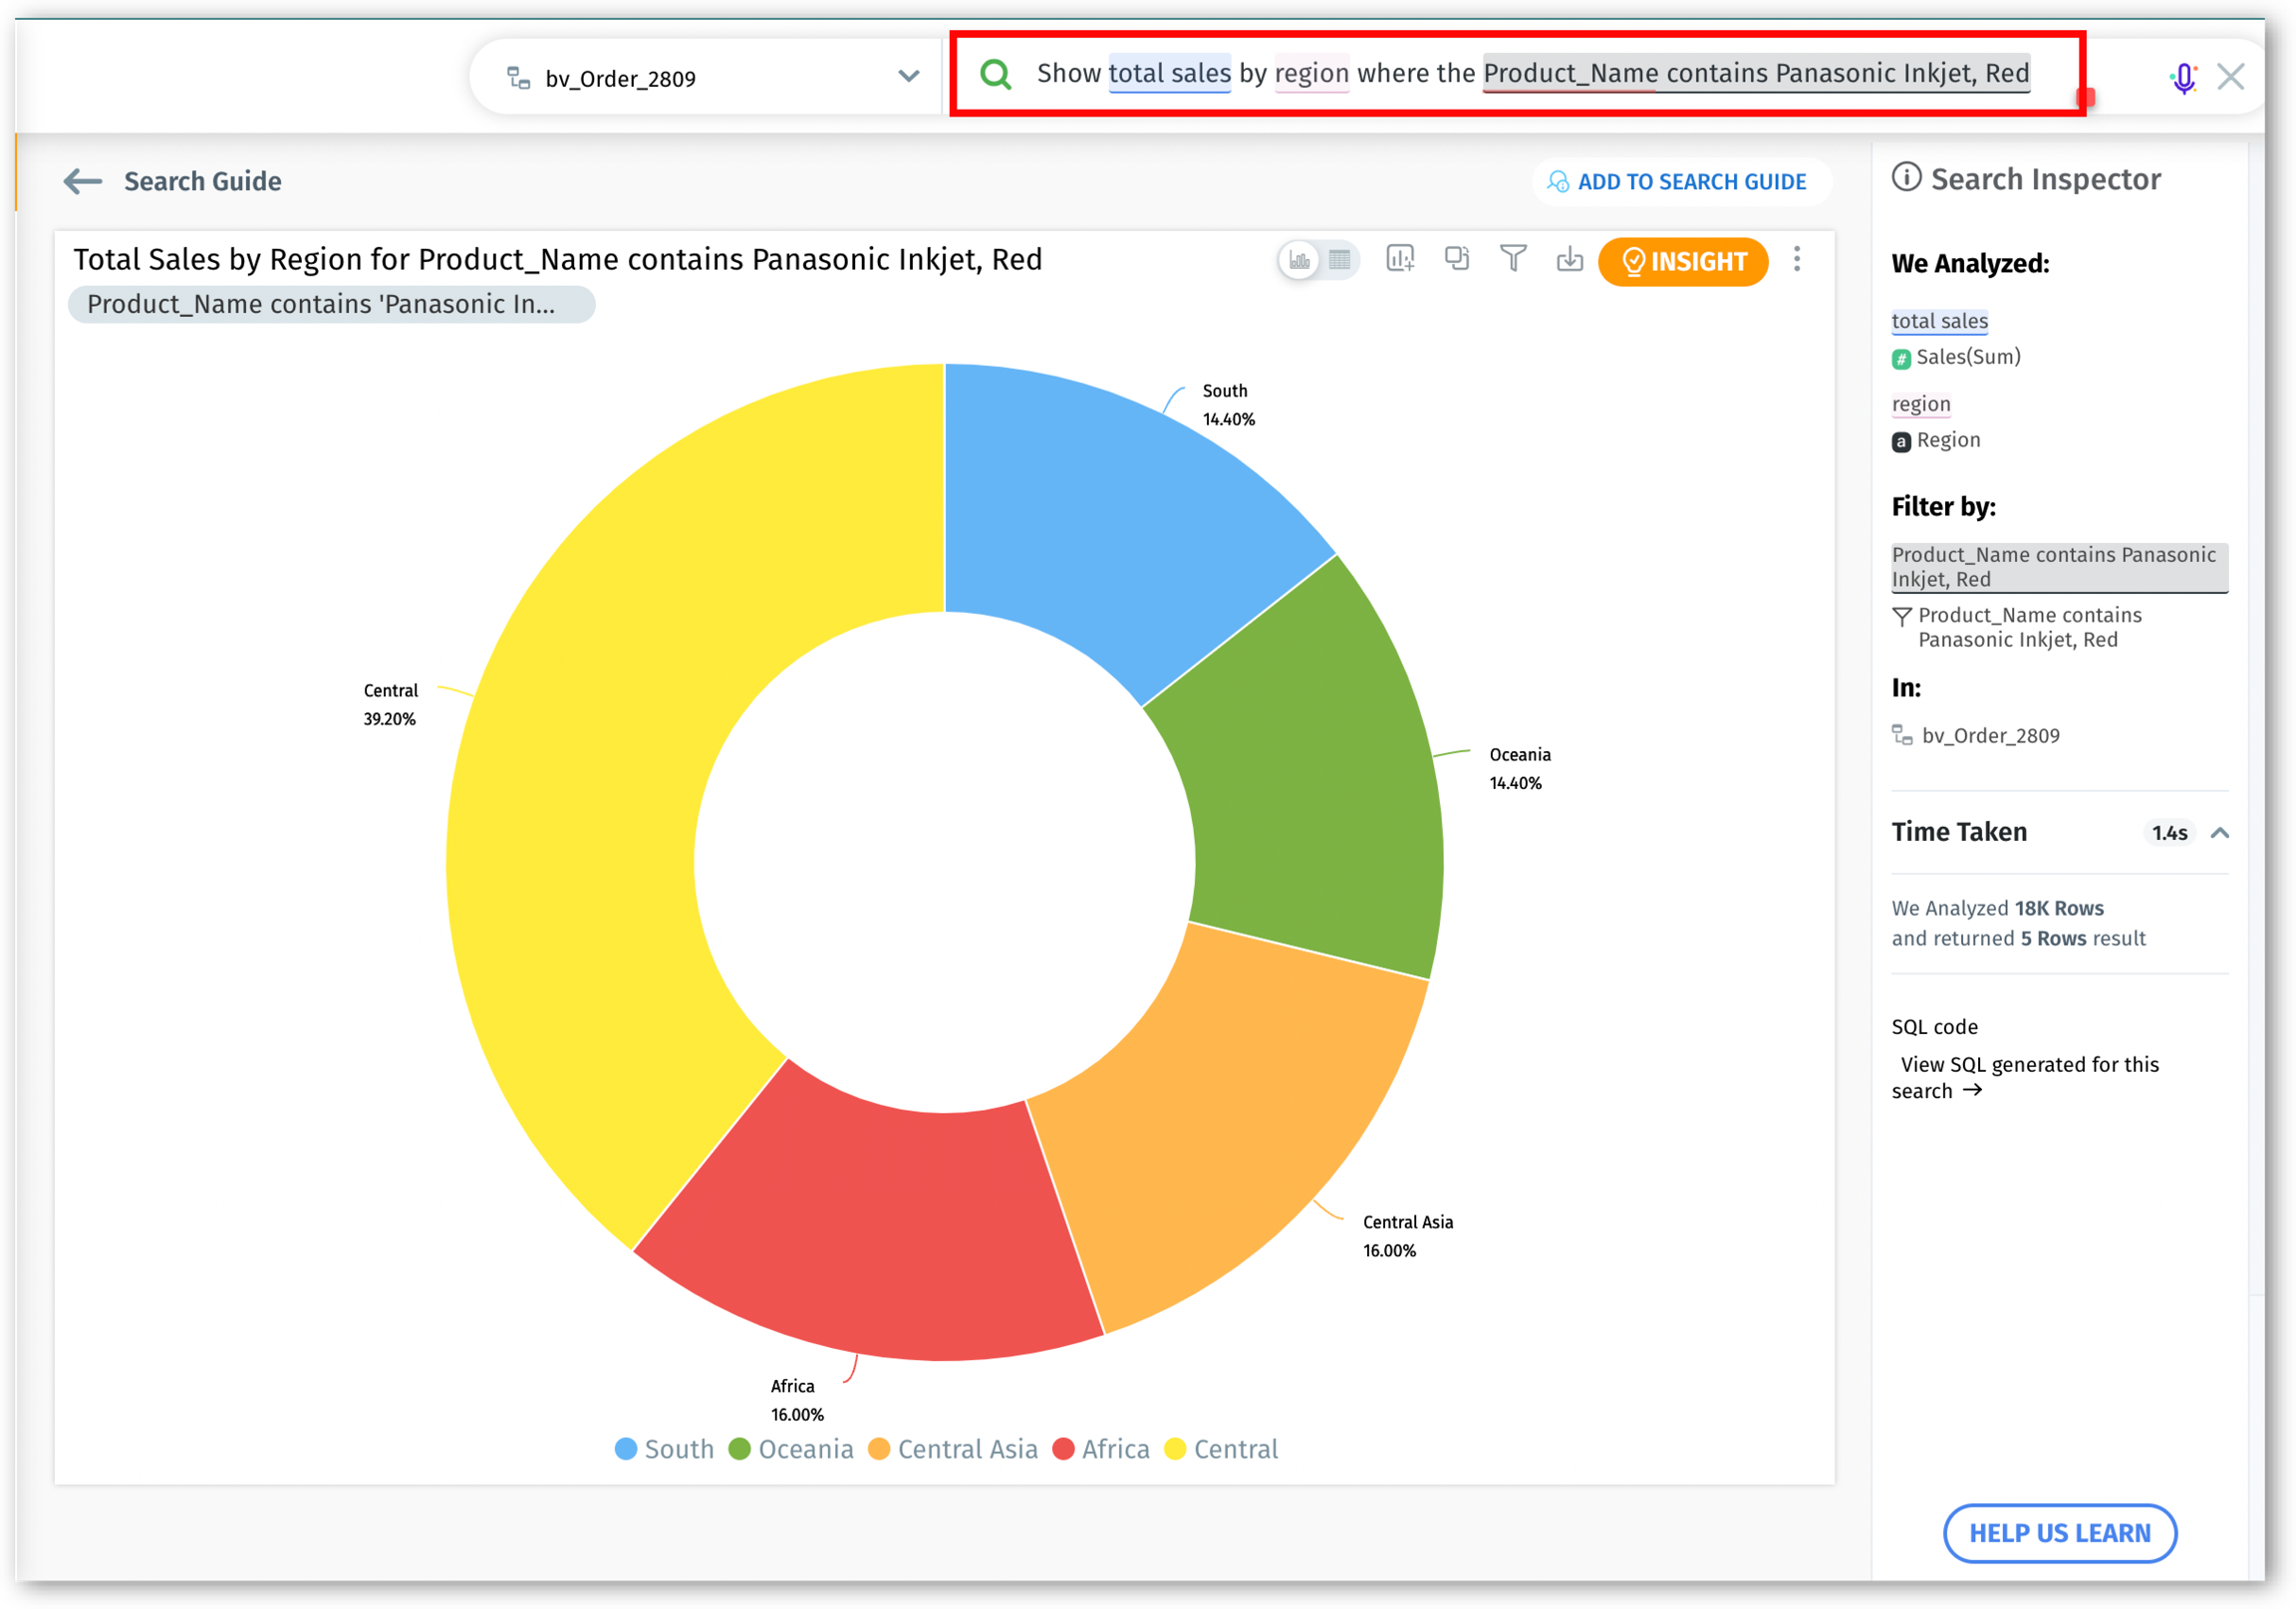
"Show total sales by region where product_name contains Panasonic"
"List employees whose job title contains 'Manager'"
"Since" or "From"
The terms "Since" and "From" are equivalent to the "greater than or equal to" (>=) operator, which will be applied to the subsequent date/time value. The data following "since" or "from" can specify a year, a month, or a specific date.
"List all transactions for product_abc since April 1, 2021"
"Show sales growth in New York since January 2020."
"Show employee turnover rates since 1/11/2021."
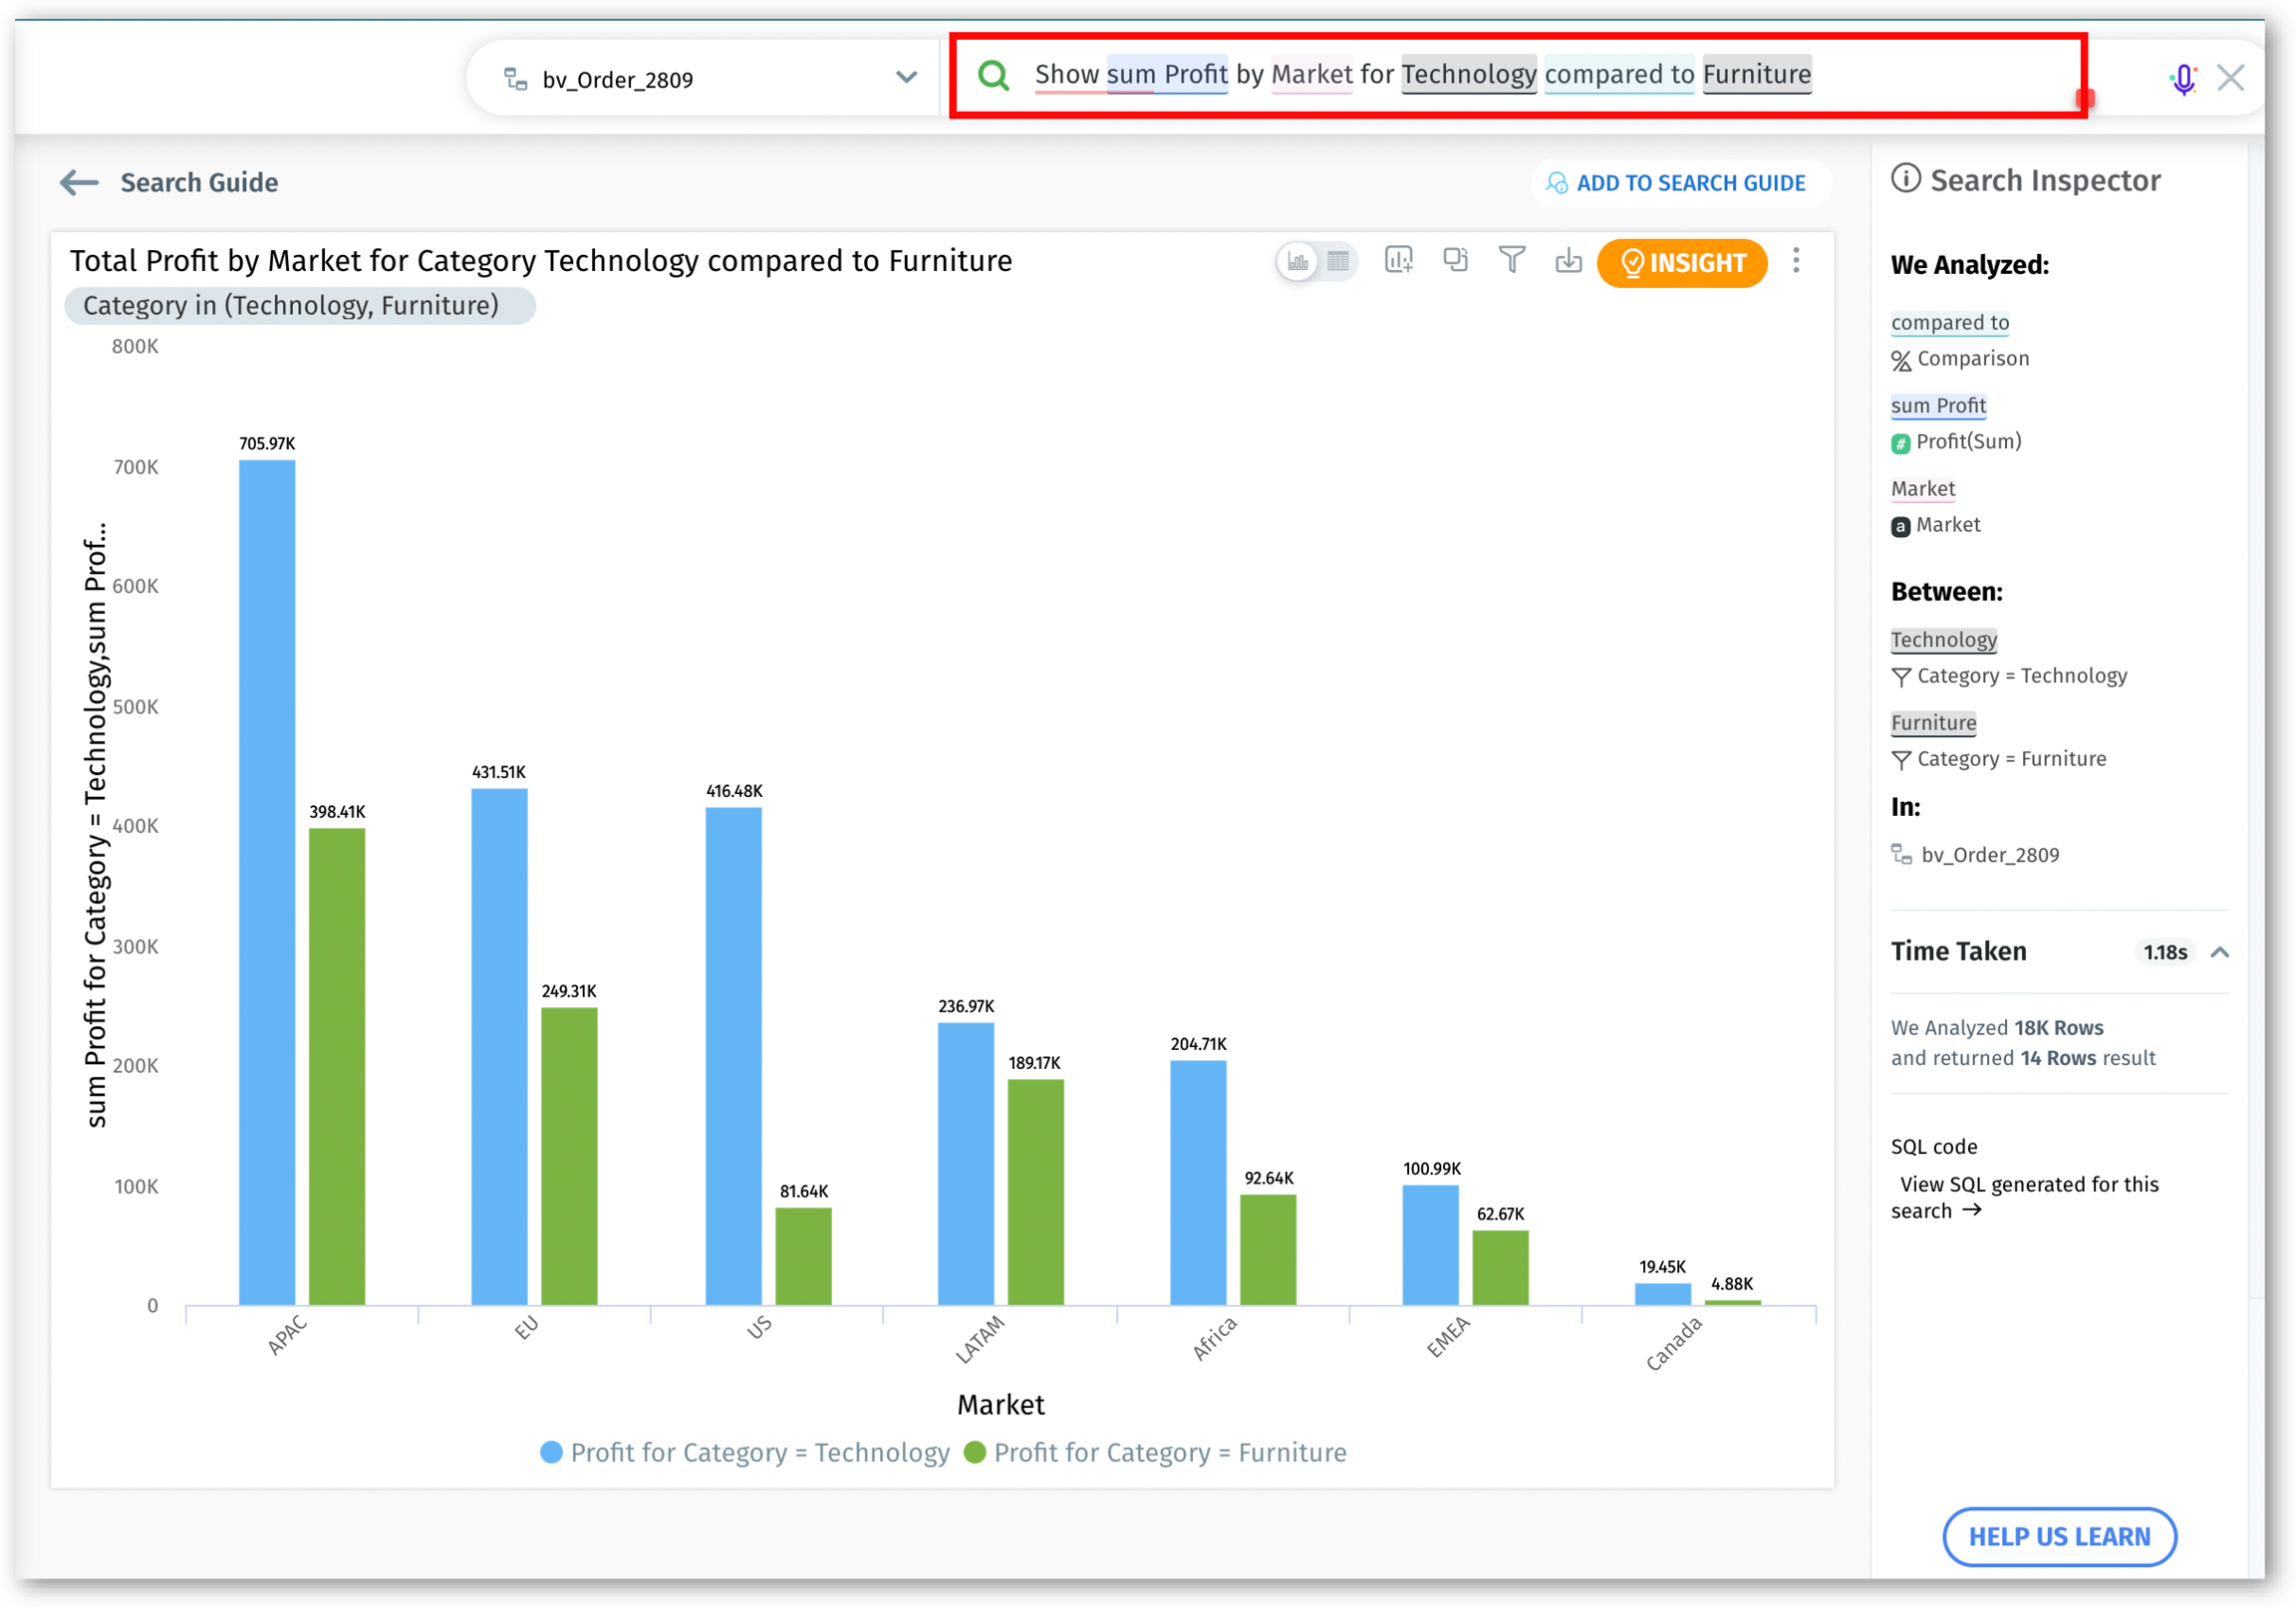
Compared to
Queries that perform comparative analysis between different data sets or values.
"Show sum profit by country for technology compared to furniture"
"Show average sales in Q1 compared to Q2"
"Show total sales by category for Ohio compared to Texas"
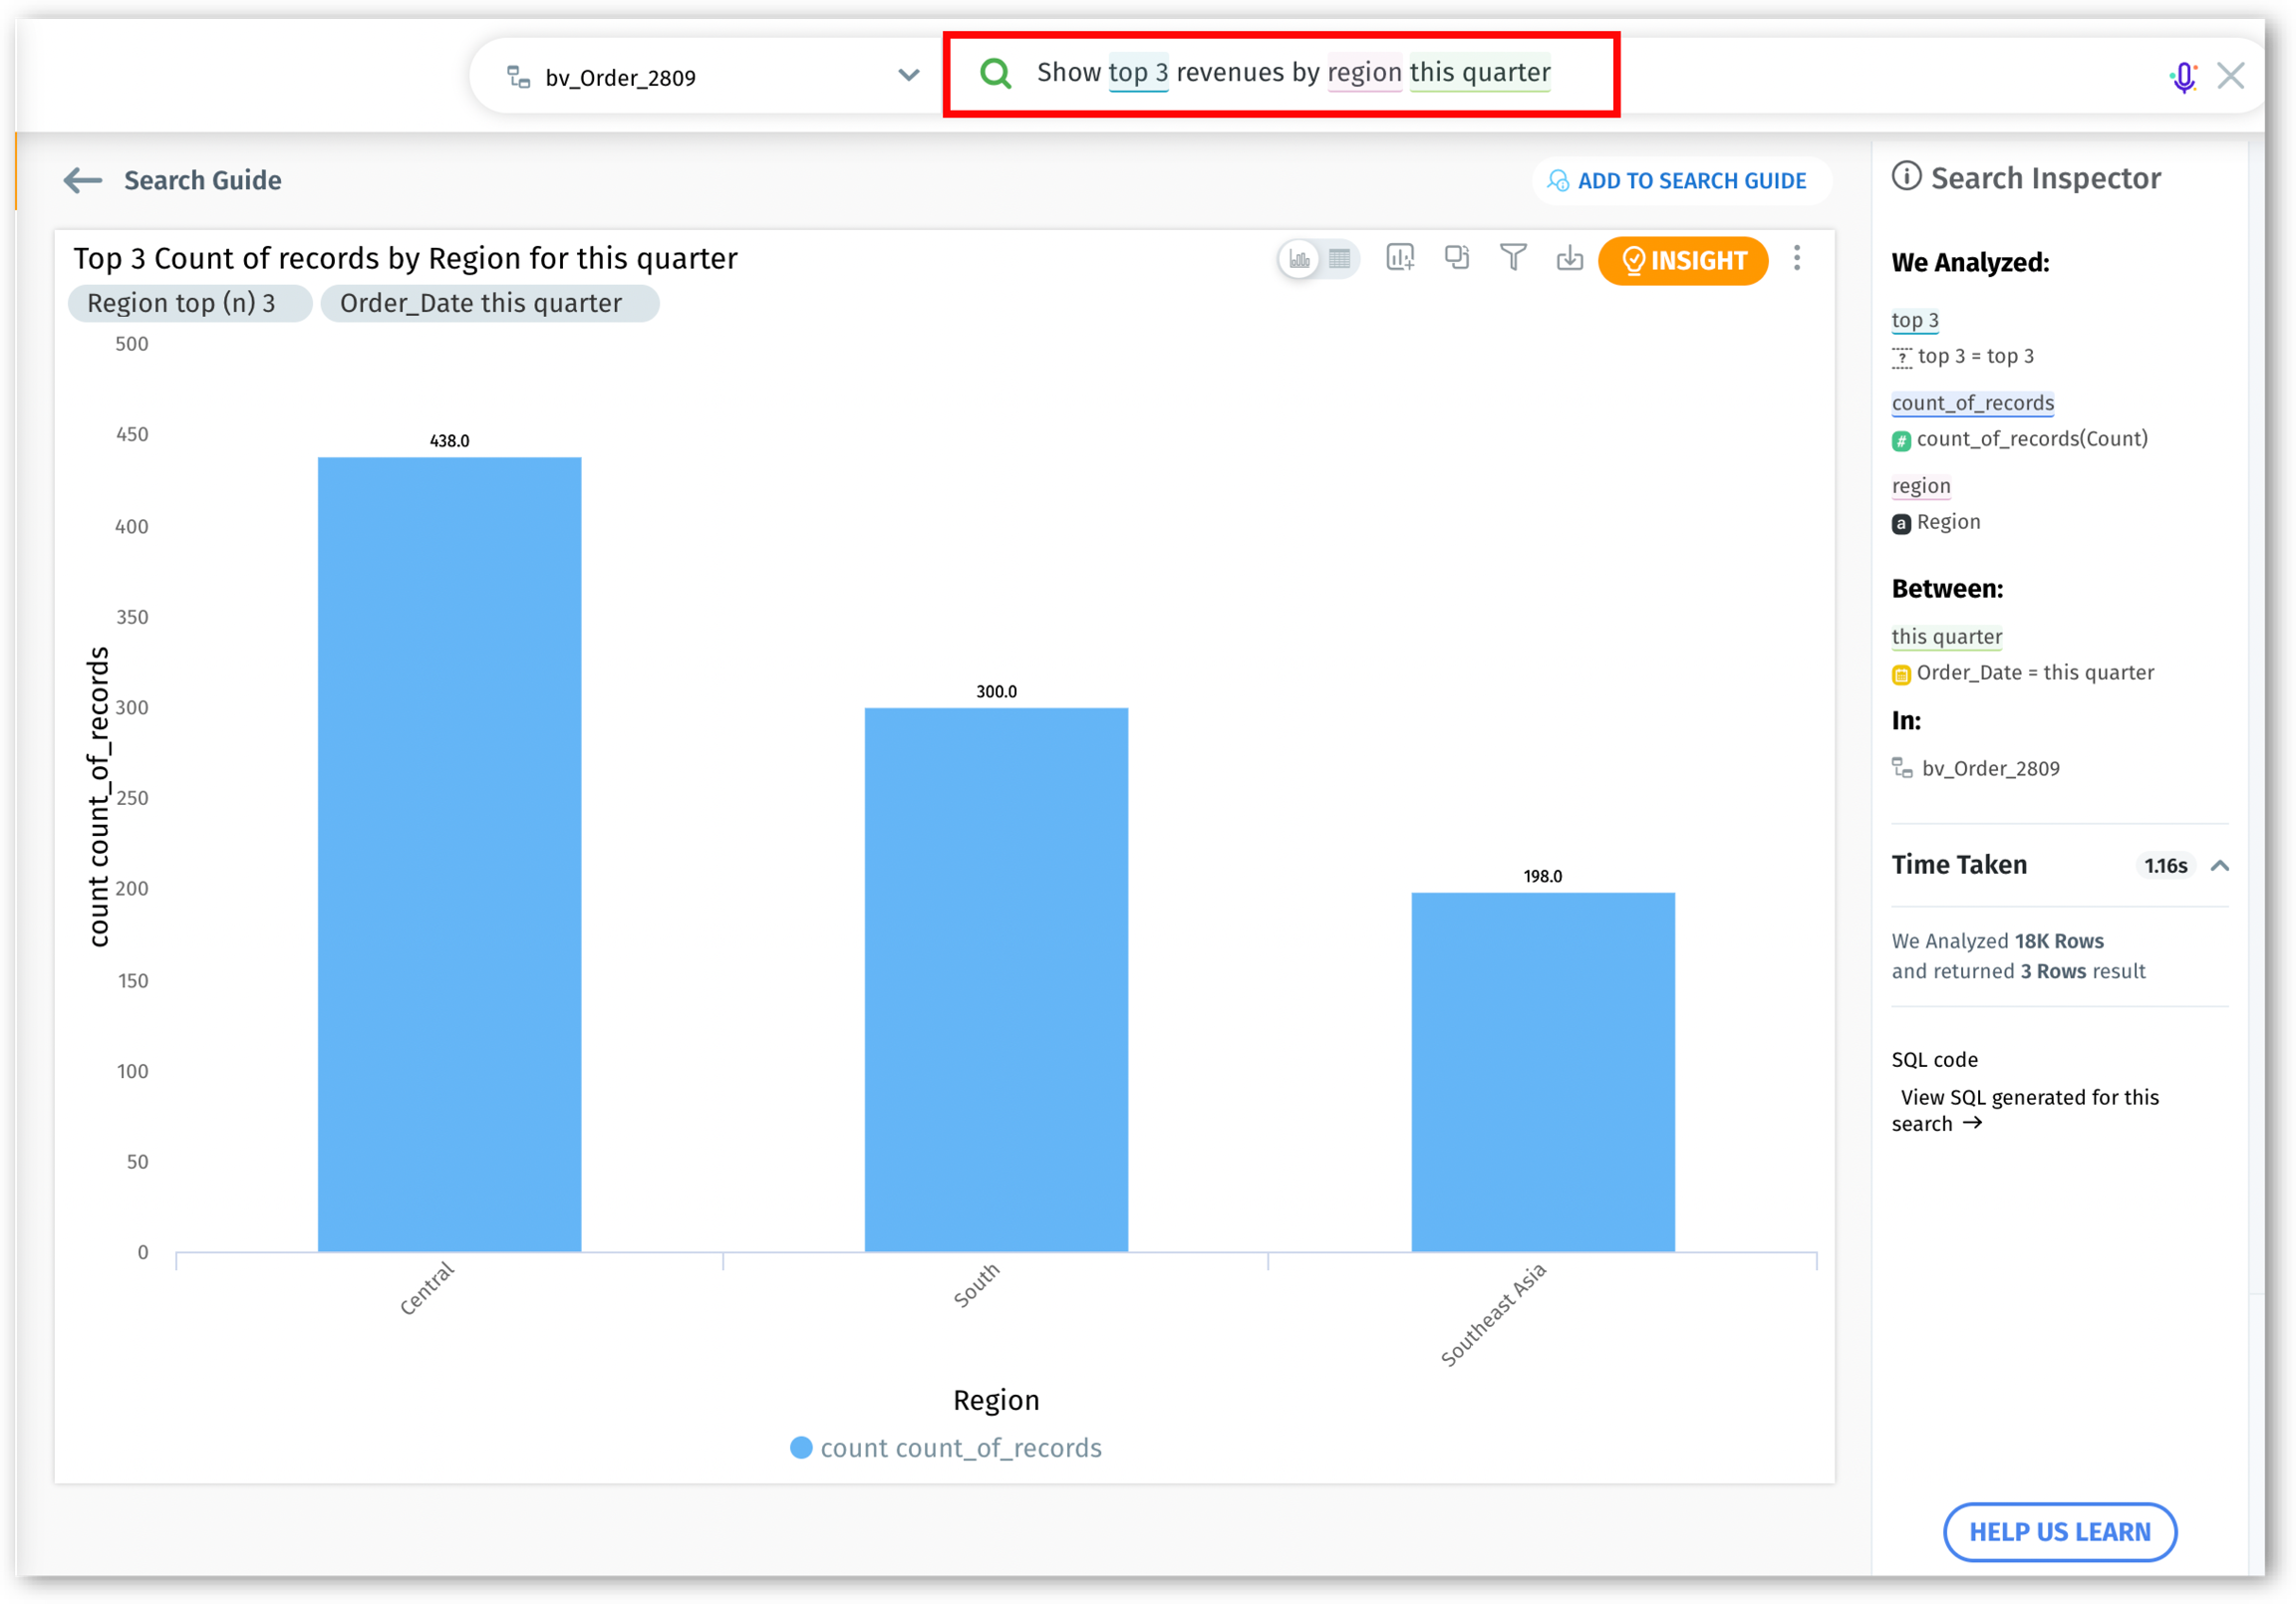
Top N and Bottom N
Queries to identify the highest or lowest-performing data points.
"Show bottom 5 employee turnover rates by department for the last 3 years."
"Show top 10 employee performance ratings by role and location."
"Show top 3 revenues by region this quarter."
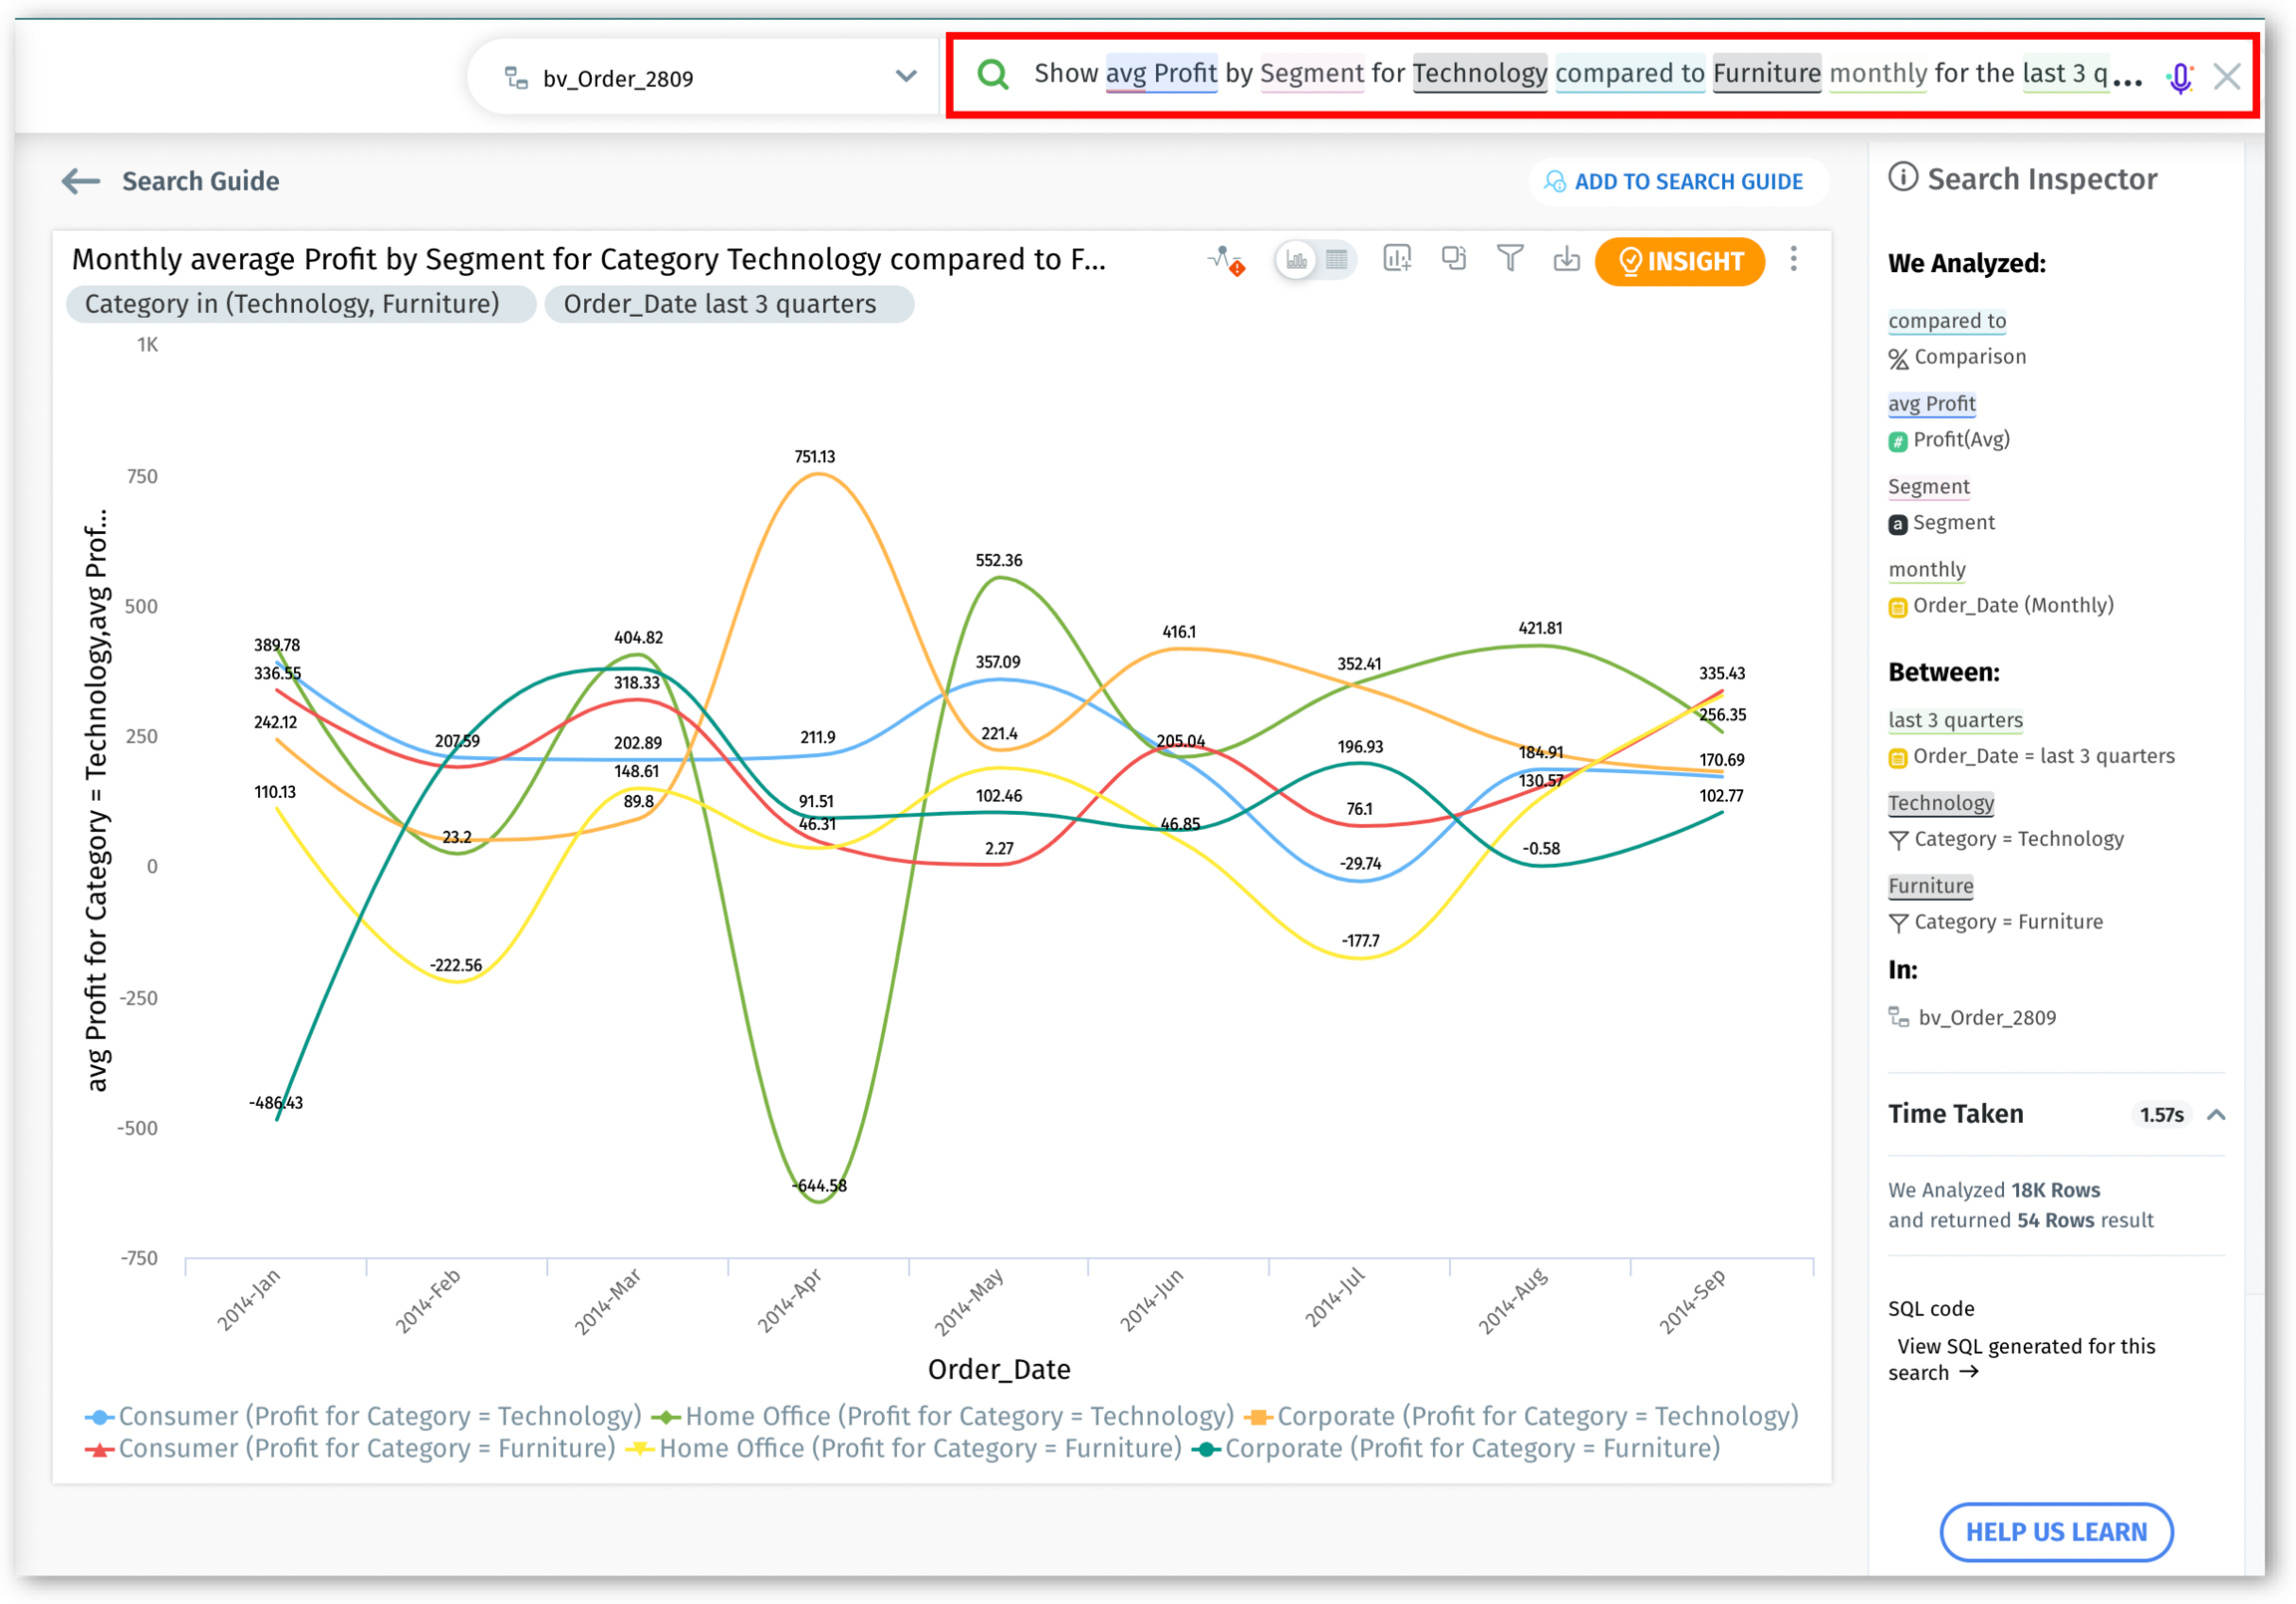
Exploring Complex Queries
Complex queries combine multiple conditionals and elements such as filter, resolution, time range, and compared to, for in-depth analysis.
"Show sum Profit by Country for Technology compared to Furniture monthly for the last 4 years."
"Show daily number of customer support calls for Software A in 2020 compared to 2021."
"Show quarterly data breach incidents for North American operations compared to European operations for the last 2 years."
Combining trends, growth, and segments
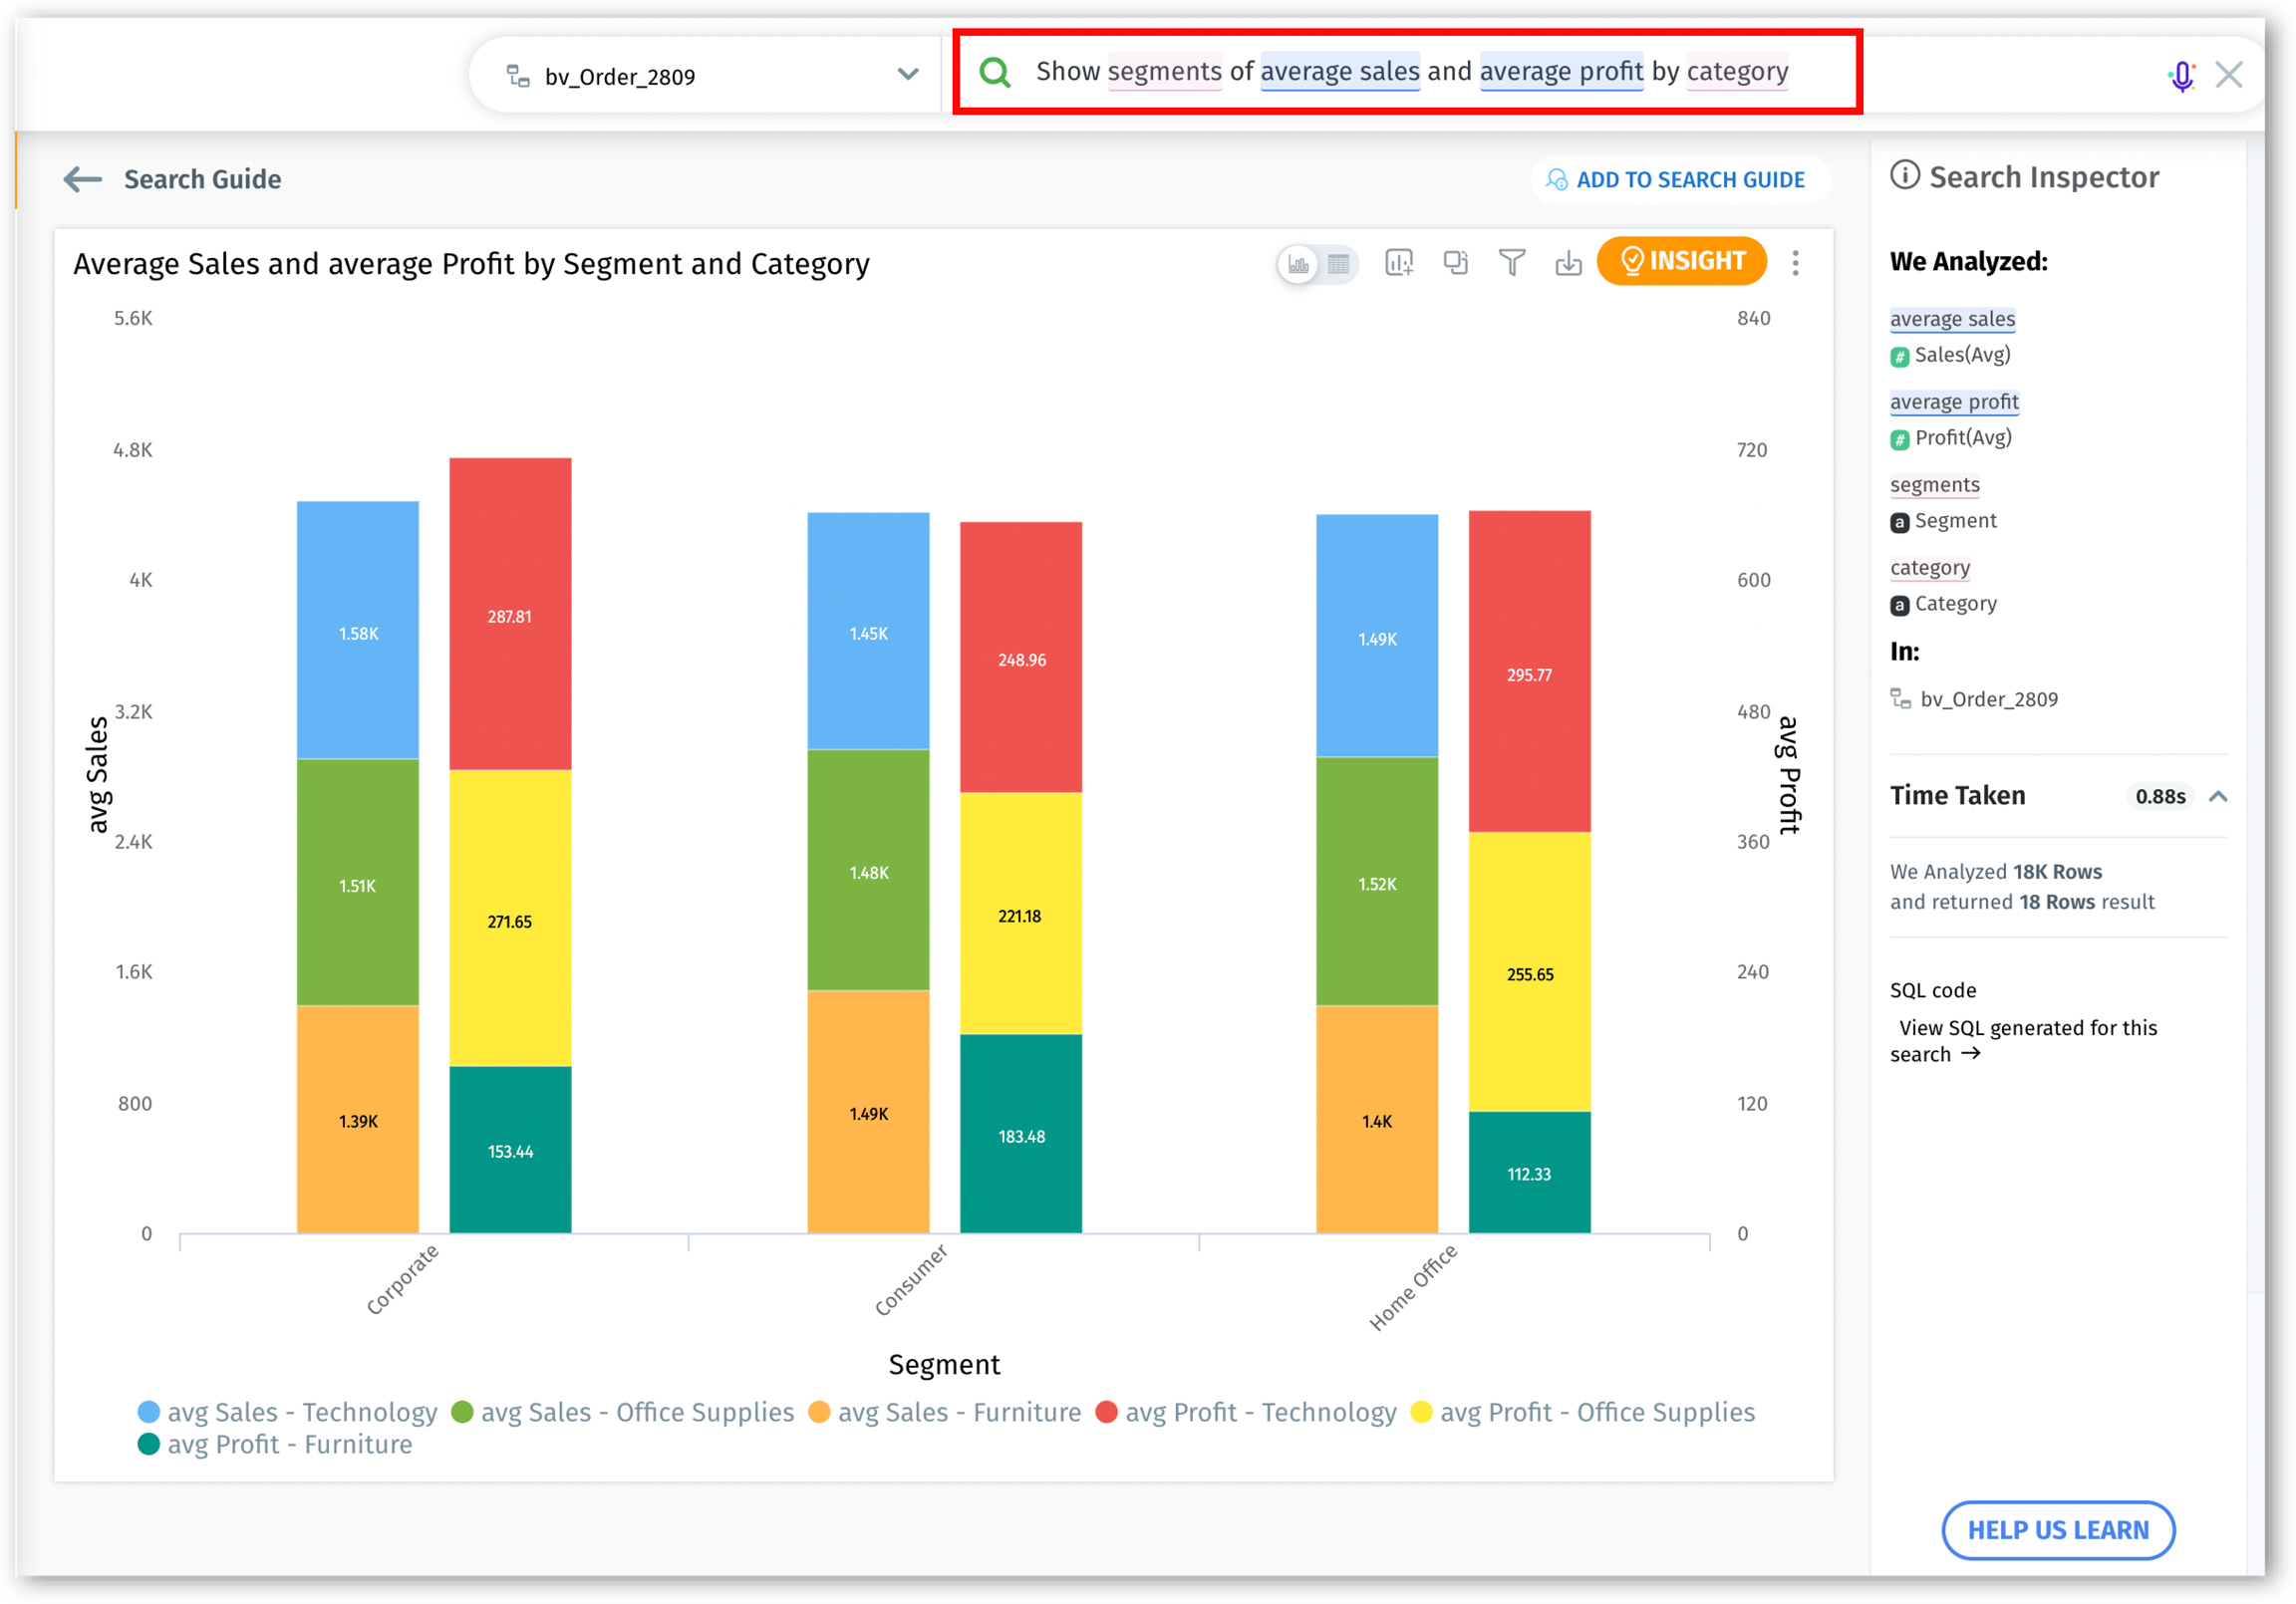
Queries aimed at analyzing trends, growth patterns, and segmenting data.
"Show segments of average sales and average revenue by category."
"Show trend of average employee retention rates monthly for this year."
"Show trend of average customer ticket resolution time monthly for this year."
Top N and Bottom N comparison with GroupBy
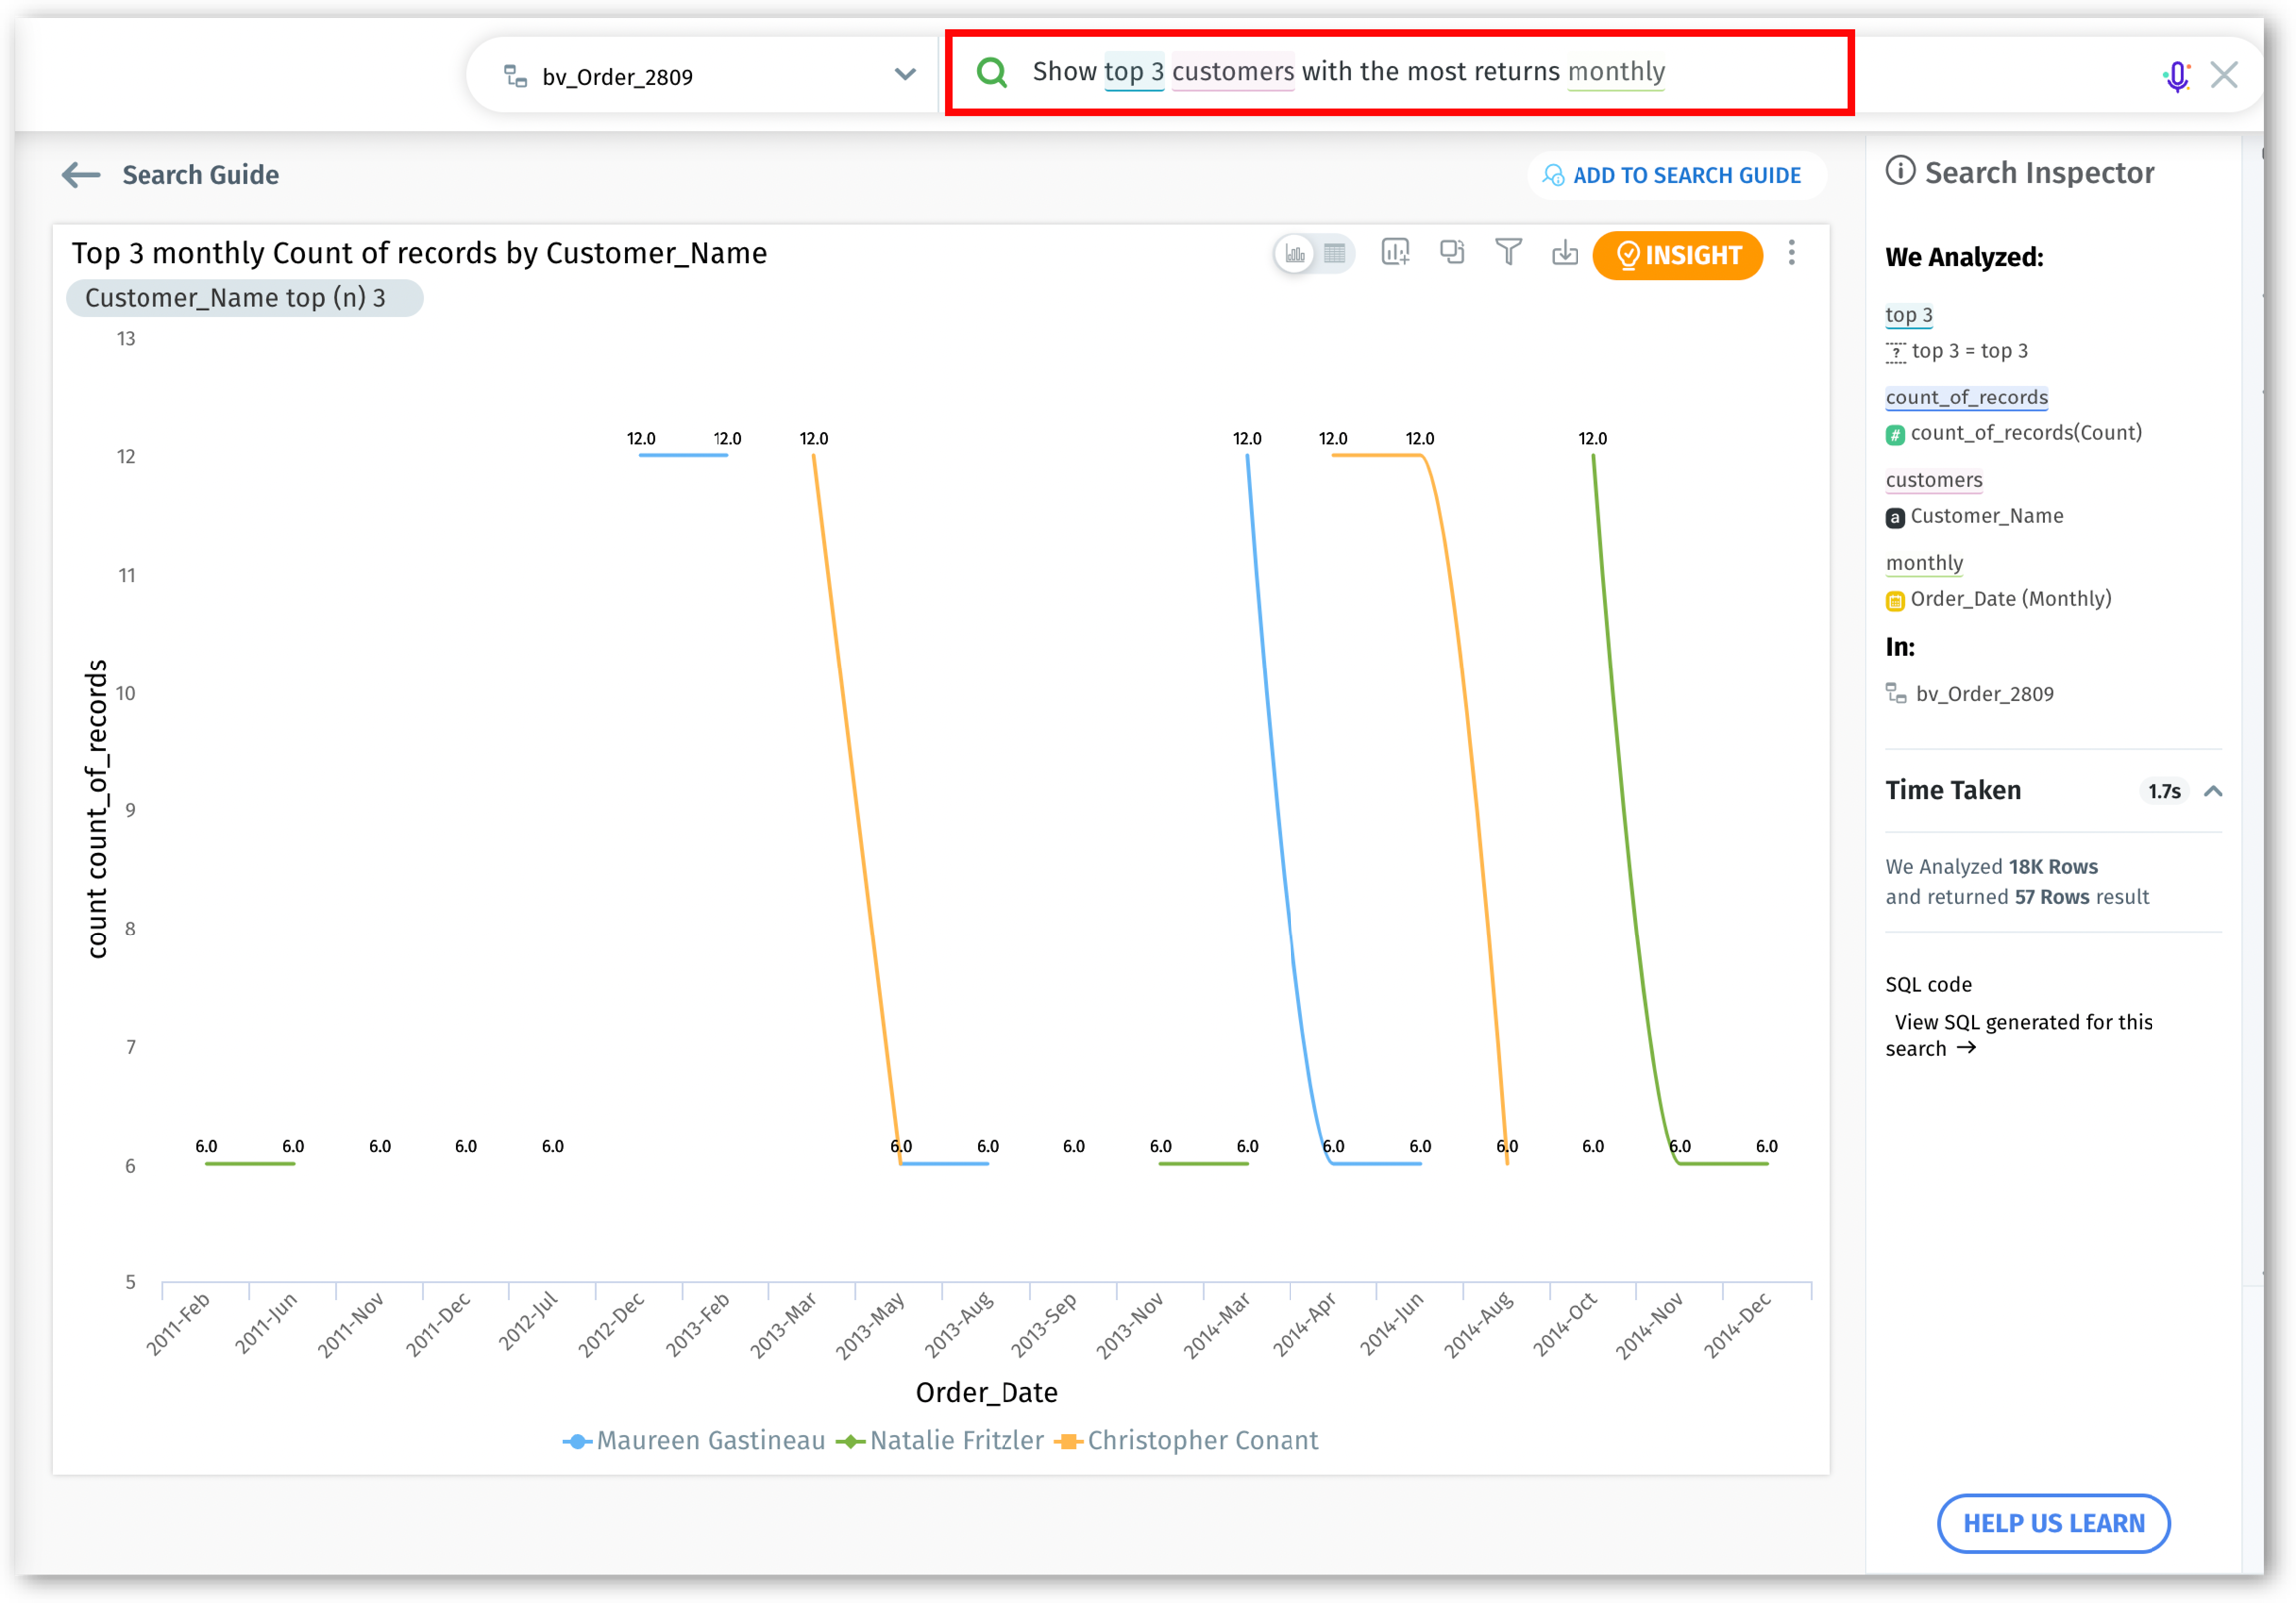
Advanced queries that rank Top N or Bottom N dimensions based on specified segments or trends.
"What are the top 5 Product Categories by Subscription rate in the region?"
"Show top 3 customers with the most returns yearly."
"List the bottom 10 vendors by revenue in the last 6 months."
Query for the immediate preceding time period
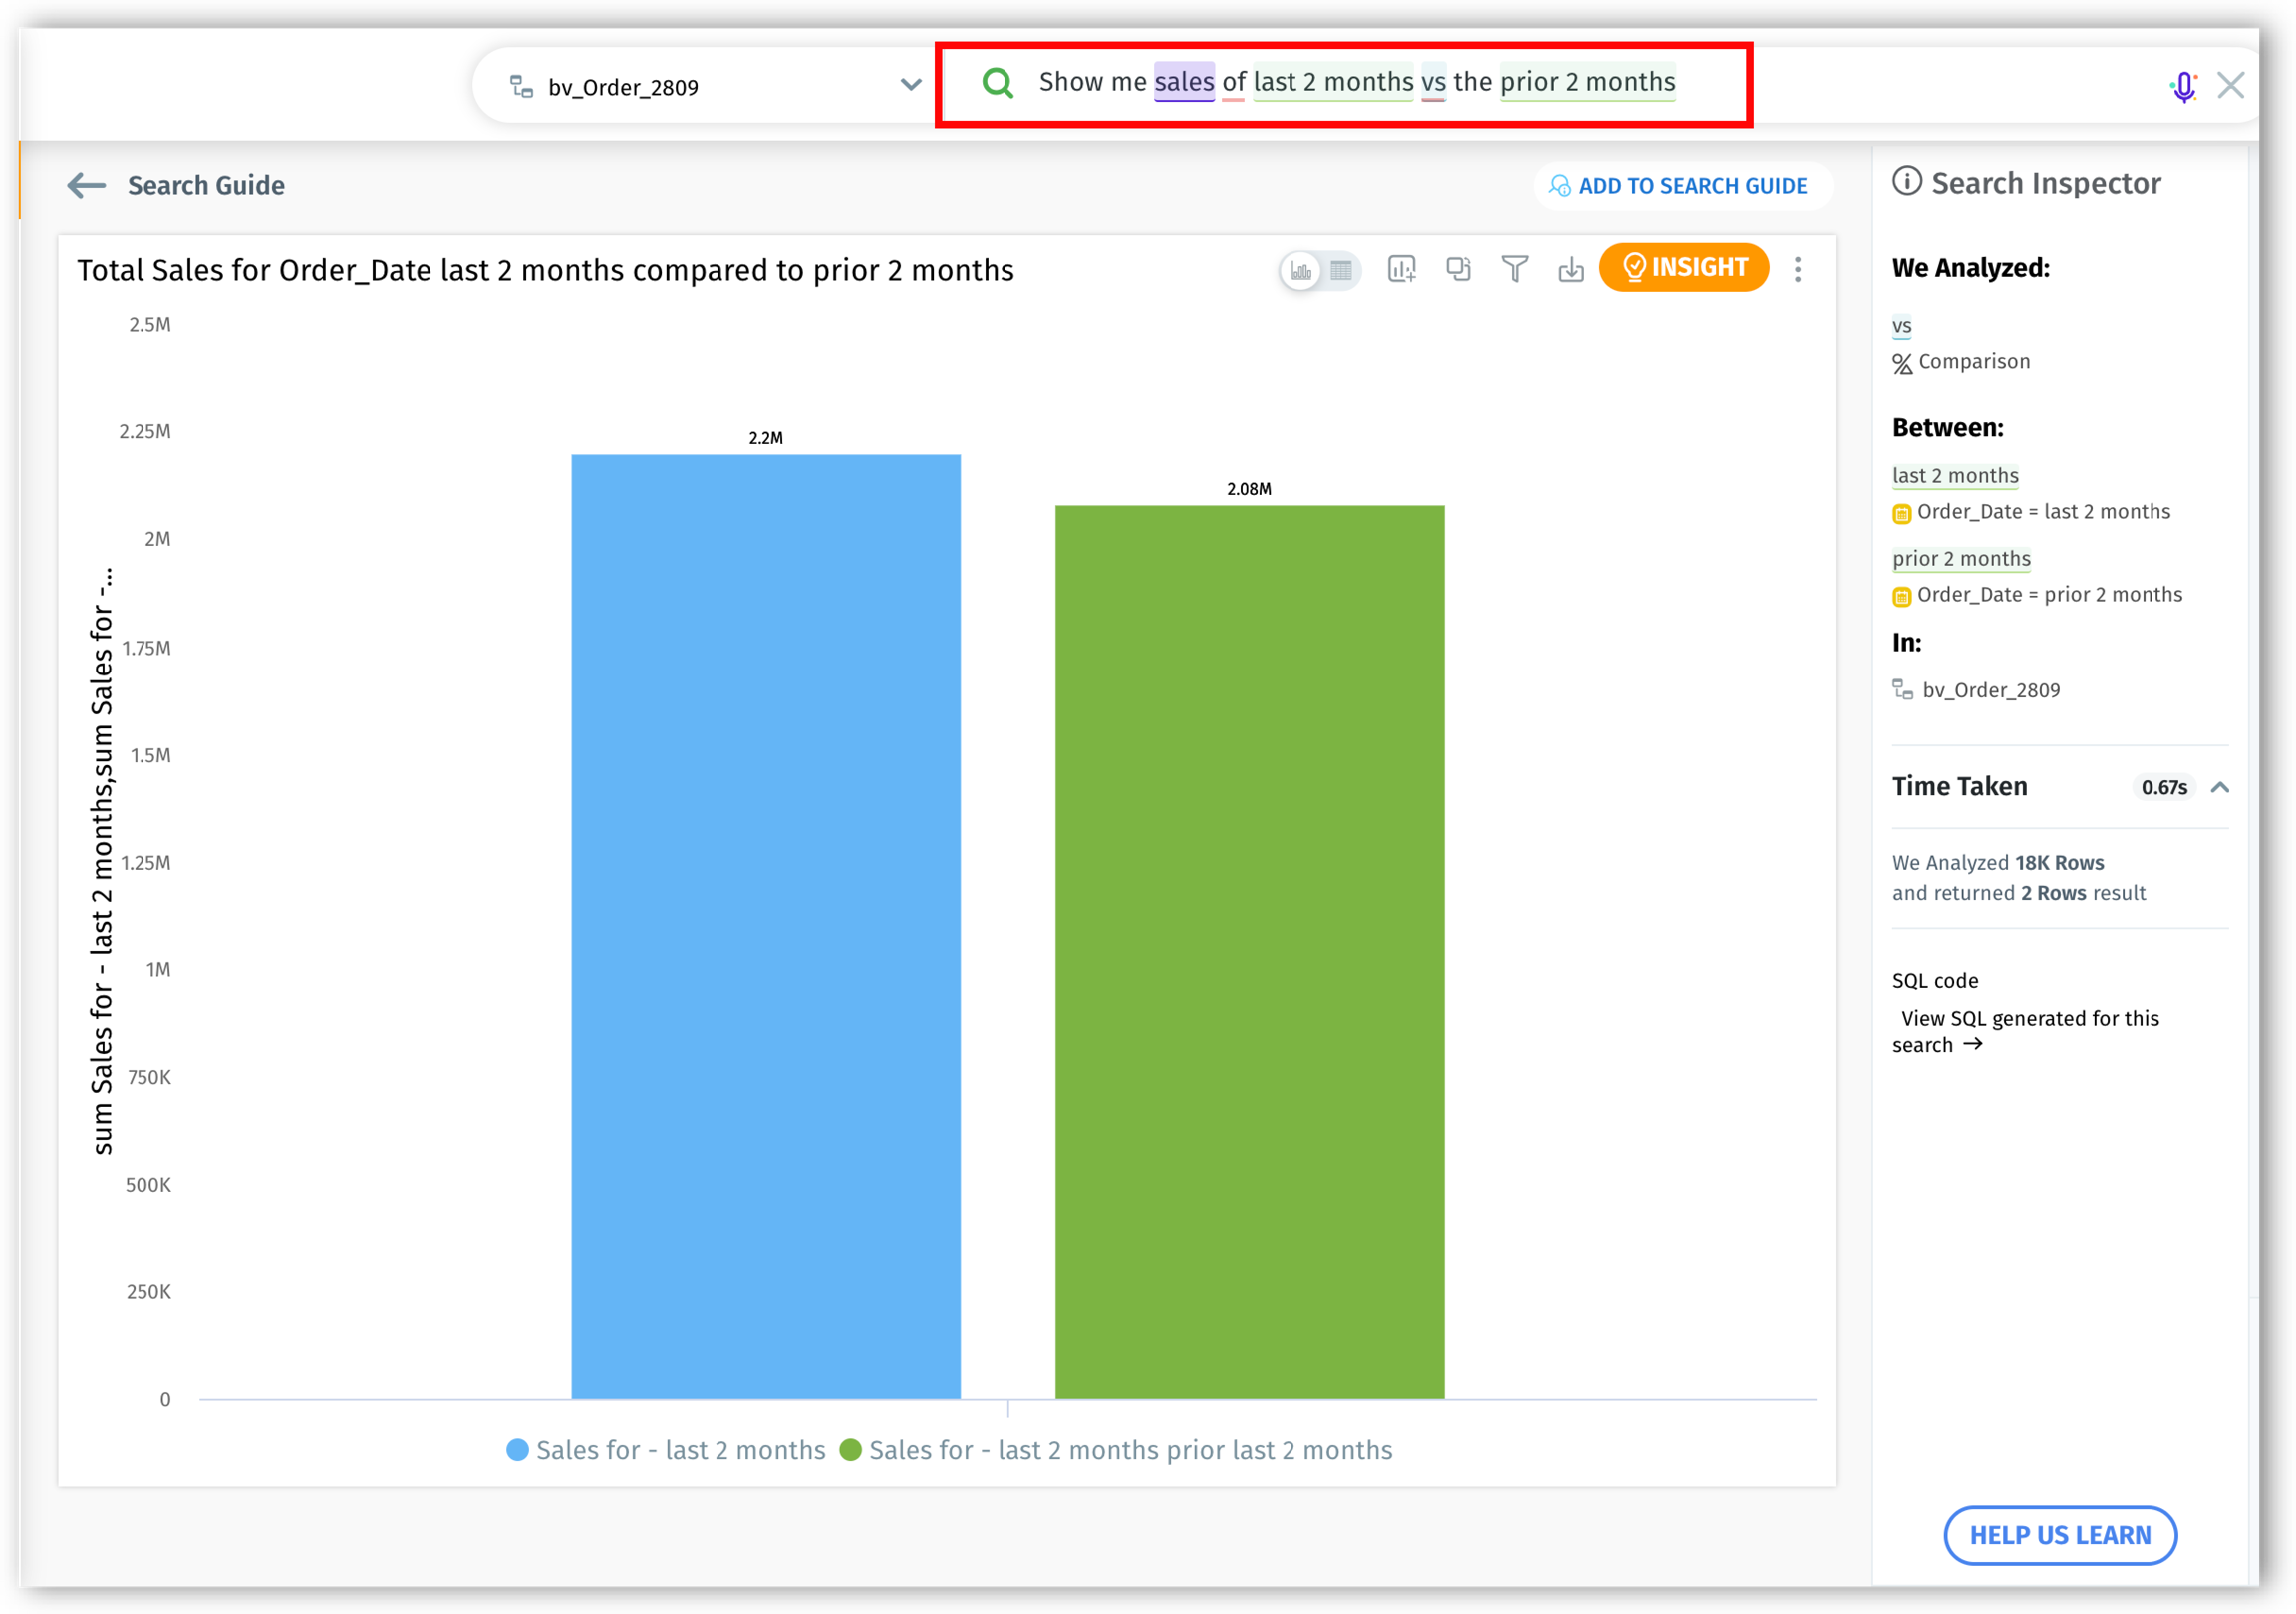
Users can compare a chosen period against its immediate predecessor to gain insights into short-term performance, identify emerging trends, and monitor current growth against recent historical data.
The query can be used for days, weeks, months, years, and quarters.
Other variations:
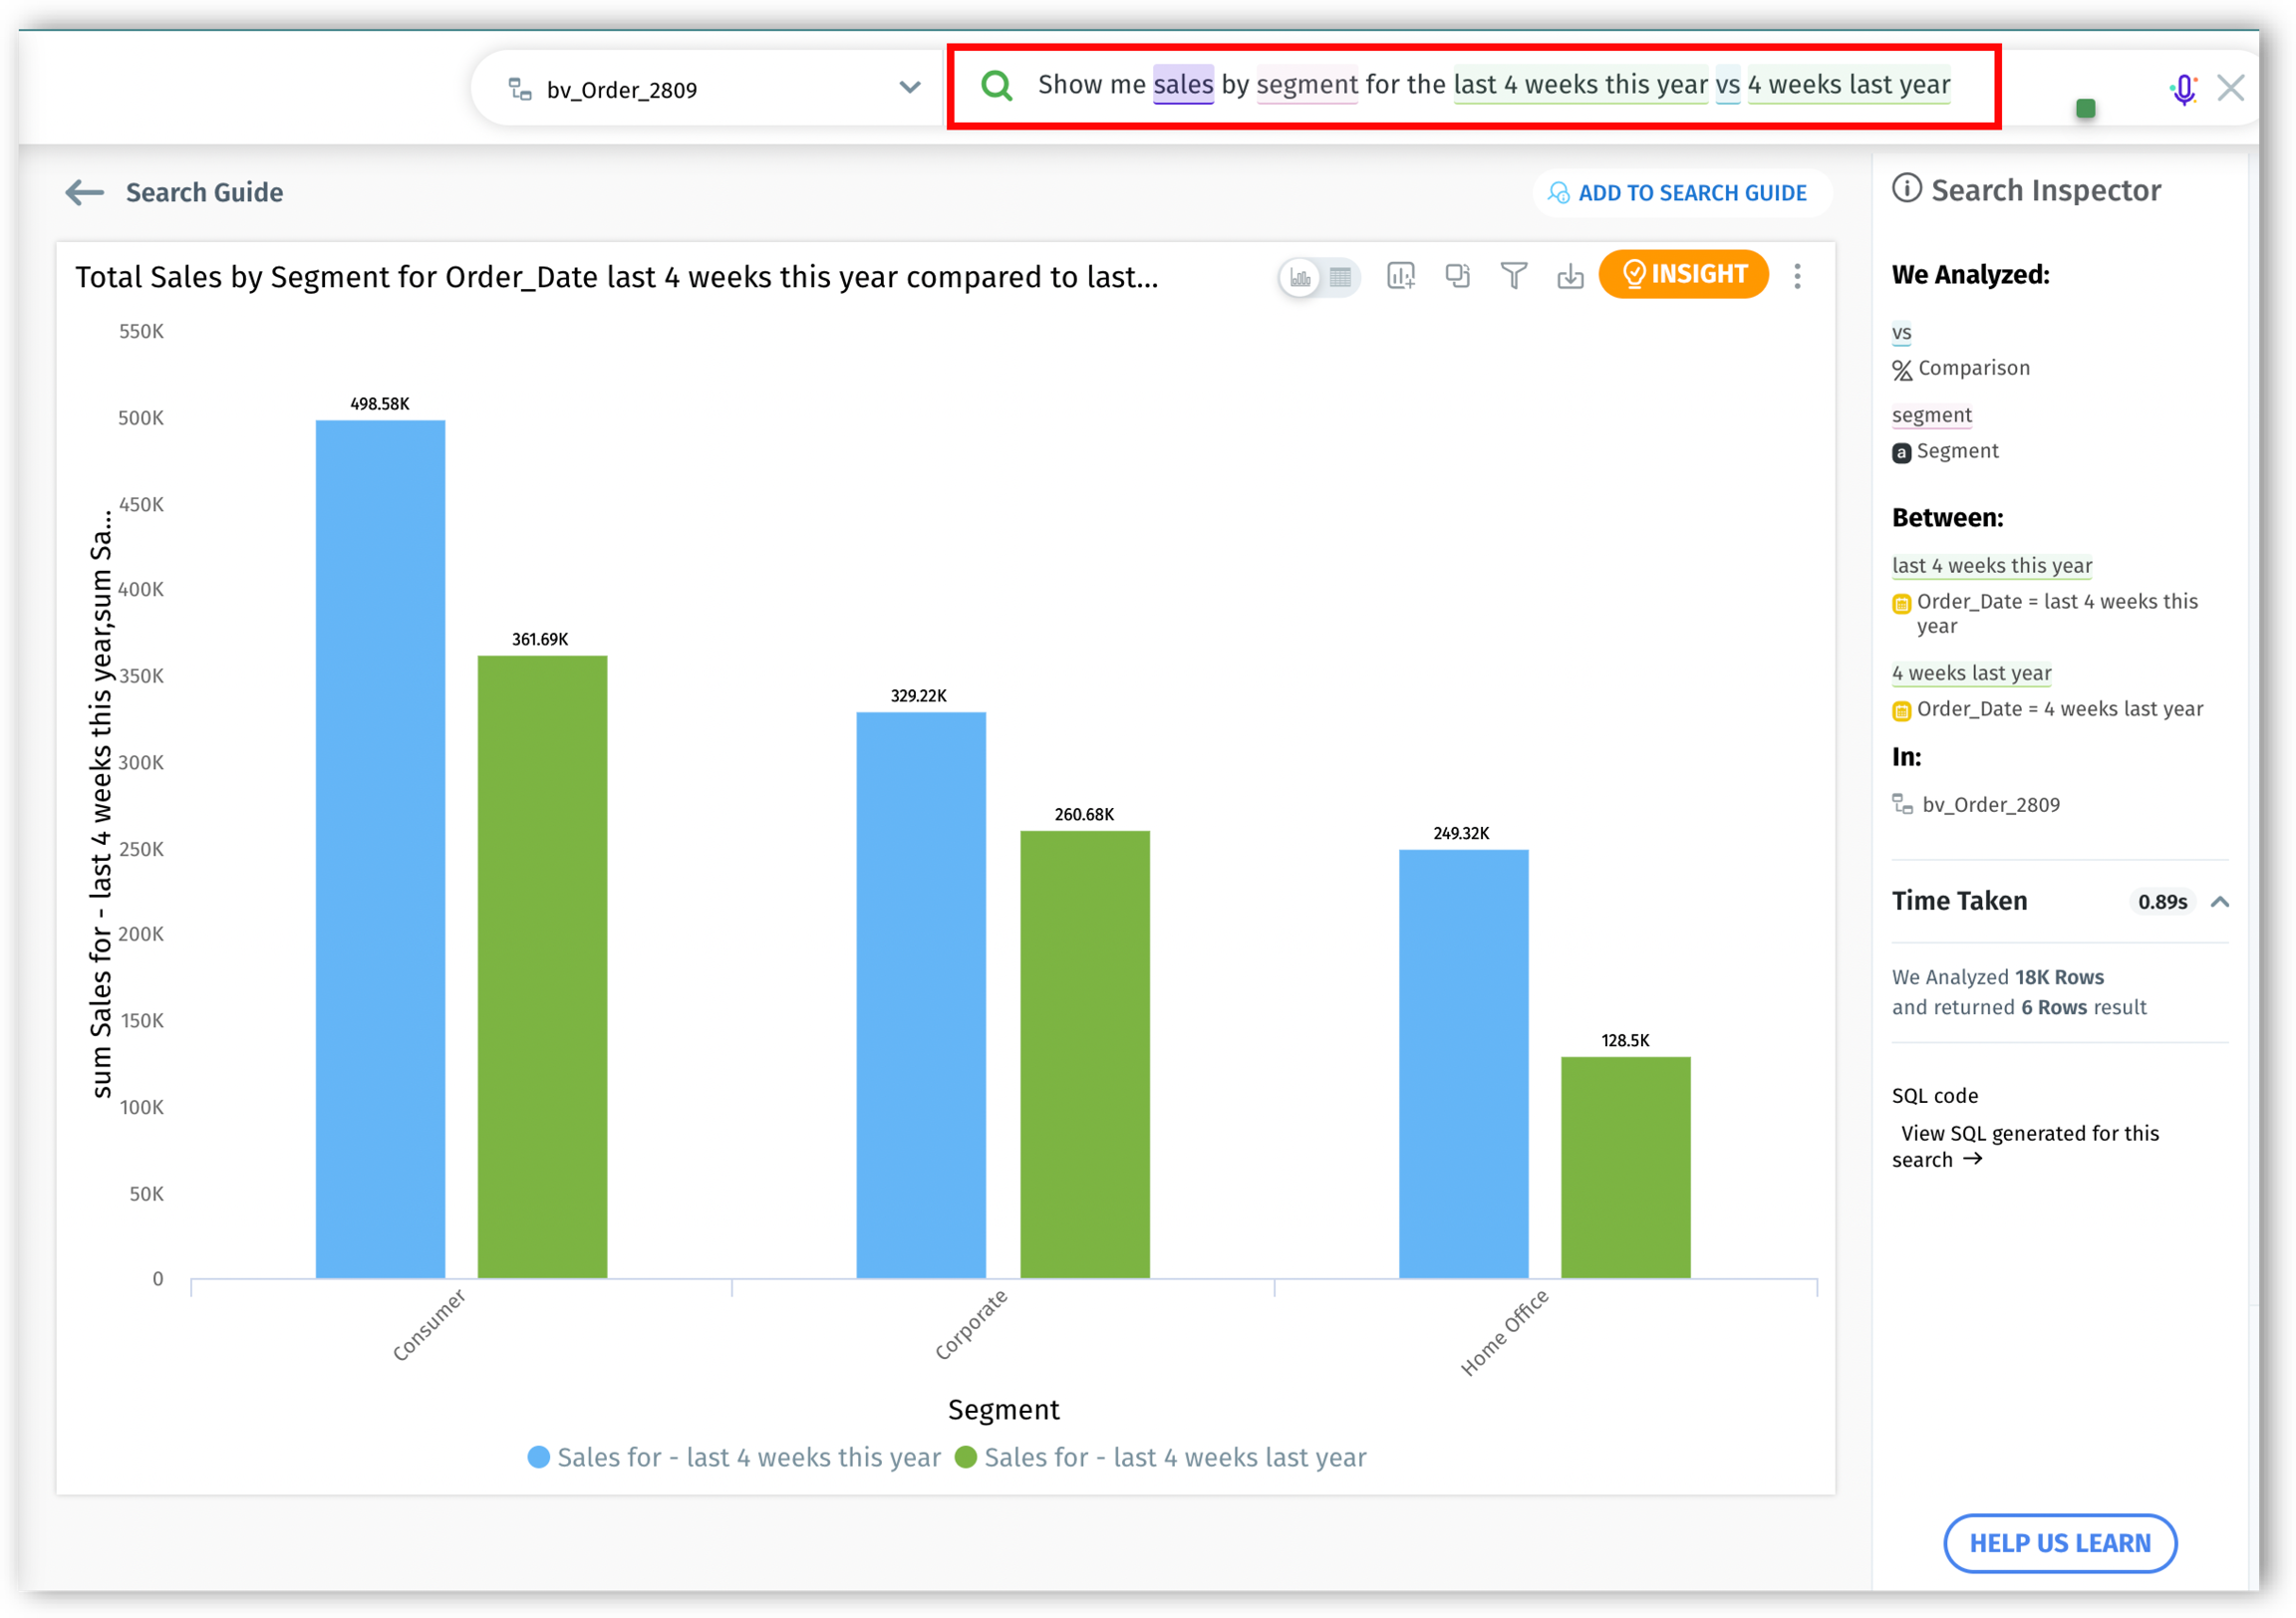
Show me sales of last n [days/weeks/months] this year [vs/compared to] prior n [days/weeks/months] last year
Show me sales of last n [days/weeks/months] [vs/compared to] the preceding period
Show me sales of last n [weeks/months] [vs/compared to] the prior n [weeks/months]
Query for YoY time period comparison
Users can assess the performance against the same time period from the previous year to understand seasonal trends, benchmark against the previous year's performance, and measure yearly growth/decline in a more granular manner.
The query can be used for days, weeks, months, years, and quarters.
Other variations:
Show me sales for the last x [days/weeks/months/quarters] this year [vs/compared to] last year
Show me sales for the last x [days/weeks/months/quarters] this year [vs/compared to] x days last yearย
Show me sales by segment for the last x [days/weeks/months/quarters] this year [vs/compared to] x [days/weeks/months/quarters] last year
Last updated
Was this helpful?