Creating Key Driver Insights
Step-by-step guide to create a new Key Driver/Segment Driver Insights
Last updated
Was this helpful?
Step-by-step guide to create a new Key Driver/Segment Driver Insights
Last updated
Was this helpful?
Navigate to the Discover tab and click on the plus button.
A list of all available Business Views will be displayed.
Sort or search the list and choose the required Business View.
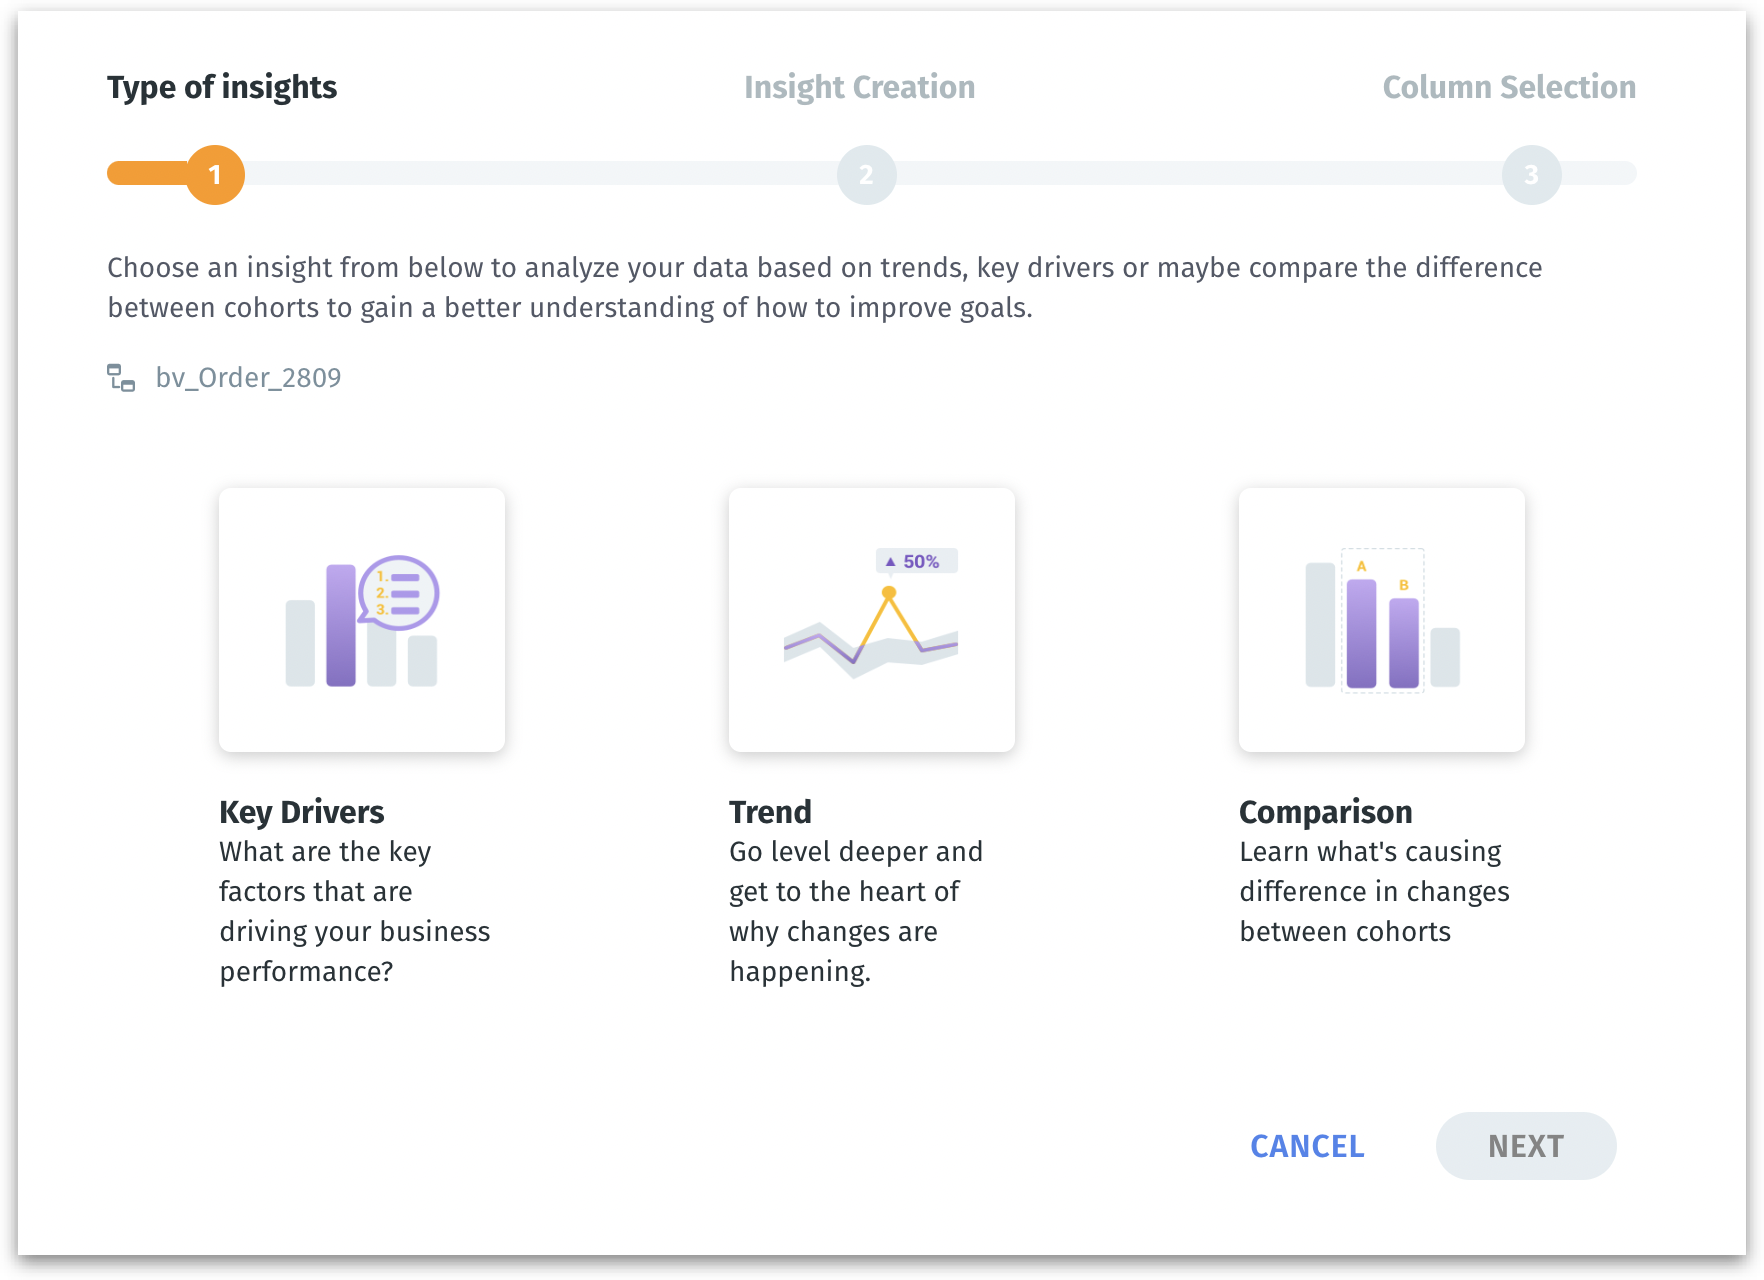
As a first step, you need to choose the type of Insight you want to create. There are three types of Insights: Key Drivers, Trend, and Comparison.
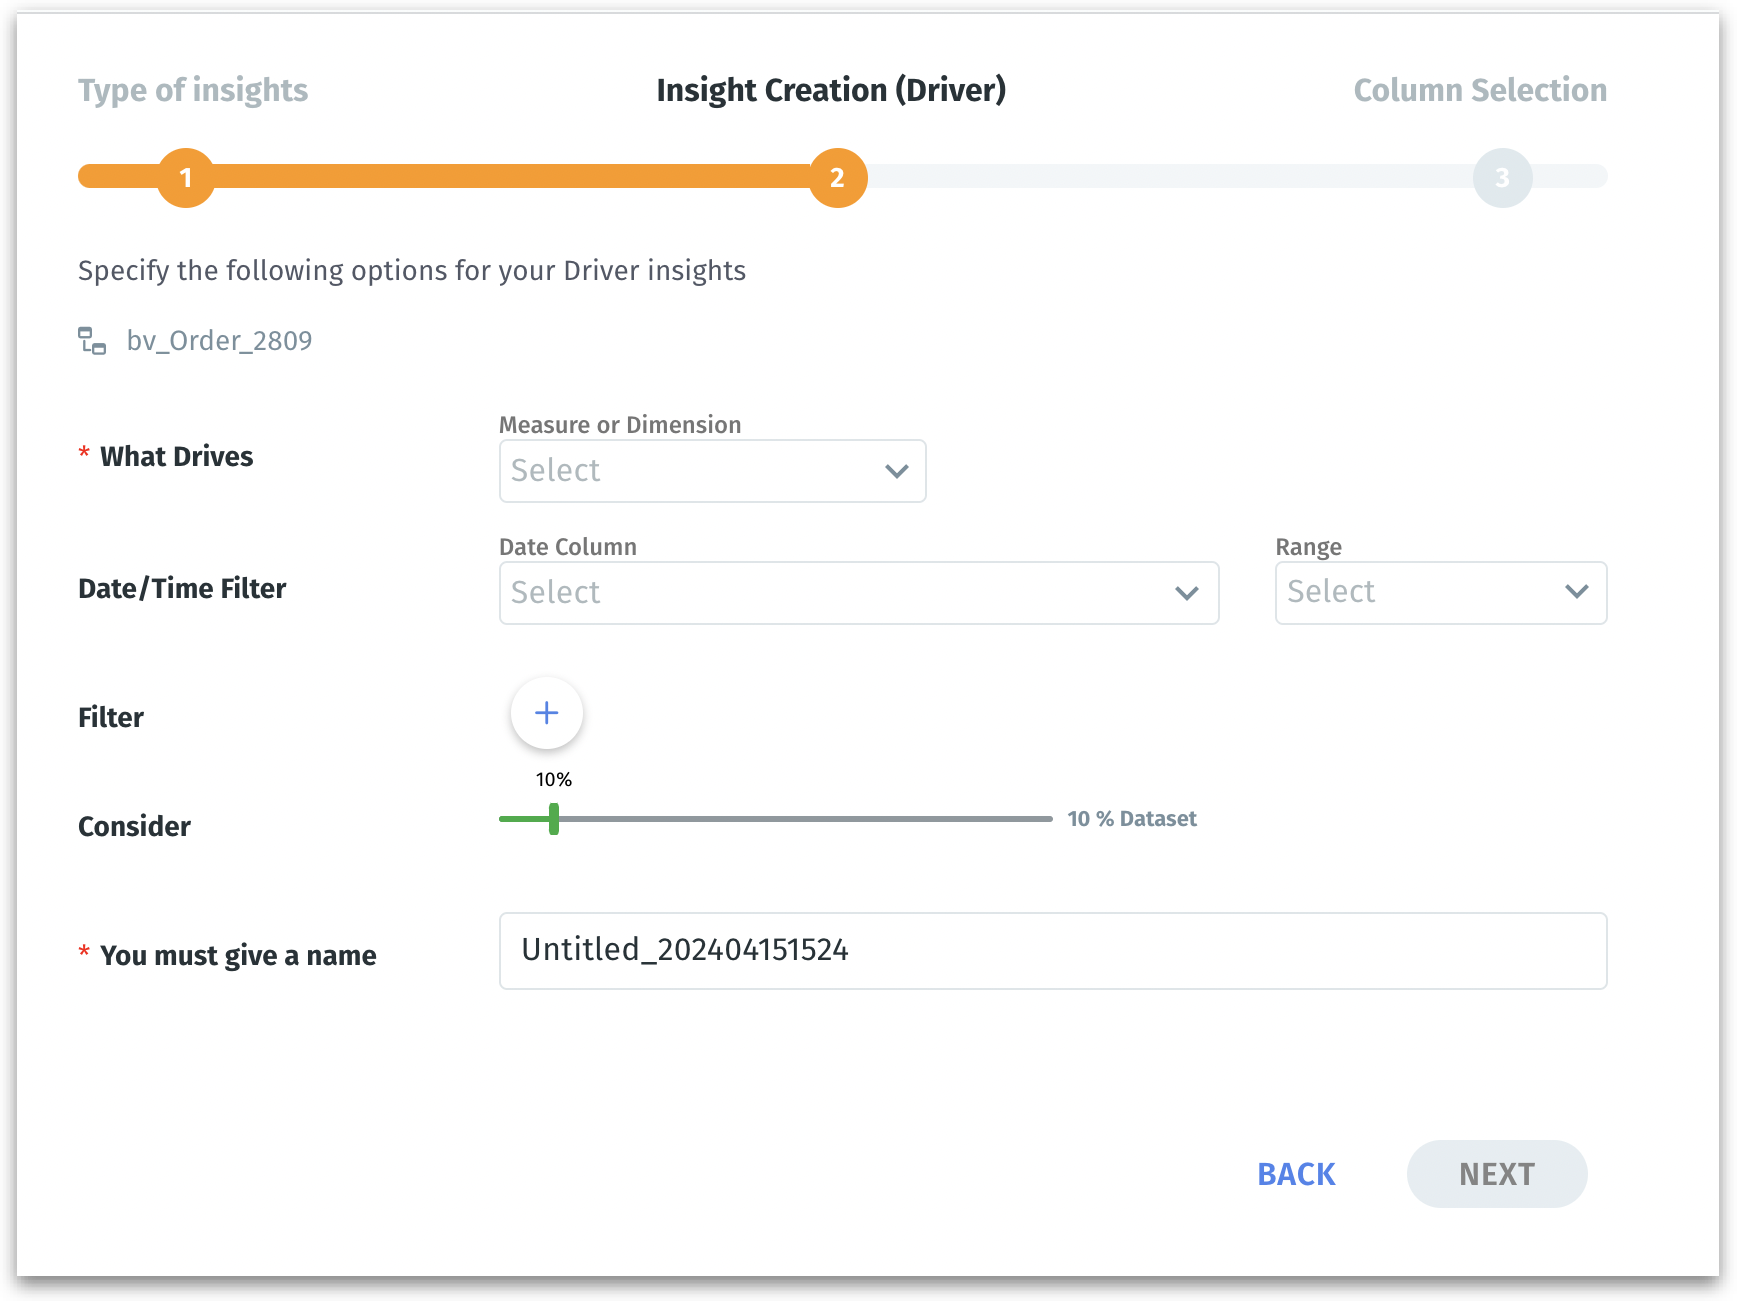
If you choose Key Driver Insight, then the next step will be displayed as follows:
Choose the influencing factors you want to examine as a potential driver of business performance. Select from a list of measures (quantitative data) and dimensions (qualitative data) from the selected Business View.
For example, choose "Revenue" as the measure because you're interested in understanding what factors drive the most sales.
Specify the time frame for the analysis. It helps in narrowing down the data to a specific period to identify trends within a given context.
For example, you can set the filter to include only data from the last fiscal quarter.
Select the required Date Columns from the dropdown list. Click on Range to specify the range of dates.
By adding filters, you can include or exclude certain data points based on predefined criteria. This fine-tunes the analysis by focusing on the most relevant data for your inquiry, such as a particular product line or customer segment.
For example, if you want to focus on transactions over $500 to identify what drives these high-value sales, you can set the filter condition: Transaction Value > $500.
Click on the "+" sign to view the filter condition fields. Select the required column, operator, and value. To apply more filters, click on the "+" sign again. Click on the "x" sign to remove the filter.
Defines the data scope of your analysis. Adjust the range selector to select the portion of the dataset that Insight should consider.
For example, if you set the "Consider" field to "50%", half of your entire dataset will be selected for the analysis. This can be particularly useful for analyzing a sample of your data when the full dataset is too large to analyze efficiently.
Give a meaningful name to your Insight and click on Next.
To know more about the differences between the three types of Insights and to choose the best Insight type as per your needs, check out .
To know more about the next step, where you want to include/exclude columns, please check out .