Standard Aggregation
Create summary tables with Standard Aggregation. Group data, apply sums, averages, and counts, and generate multi-dimensional insights for deeper analysis.
Standard Aggregation allows you to summarize your dataset to extract meaningful insights. By grouping data and applying aggregate functions (e.g., sum, average), you can analyze specific groups or variables. It's particularly useful for creating summaries, generating metrics, and preparing data for further analysis.
You can use standard aggregation for:
Sales analysis: Group sales data by region and calculate total revenue per region using the Sum function.
Customer insights: Group customer data by age groups and calculate the average purchase value per group using the Average function.
Performance metrics: Calculate the count of transactions for each product category and display the ratio of each category to the total transactions.
Steps to perform standard aggregation
Under Data → Prepare → Data, select the required dataset and click on Edit.
Above Data Pipeline, click on the Aggregate option.

The following window will be displayed.
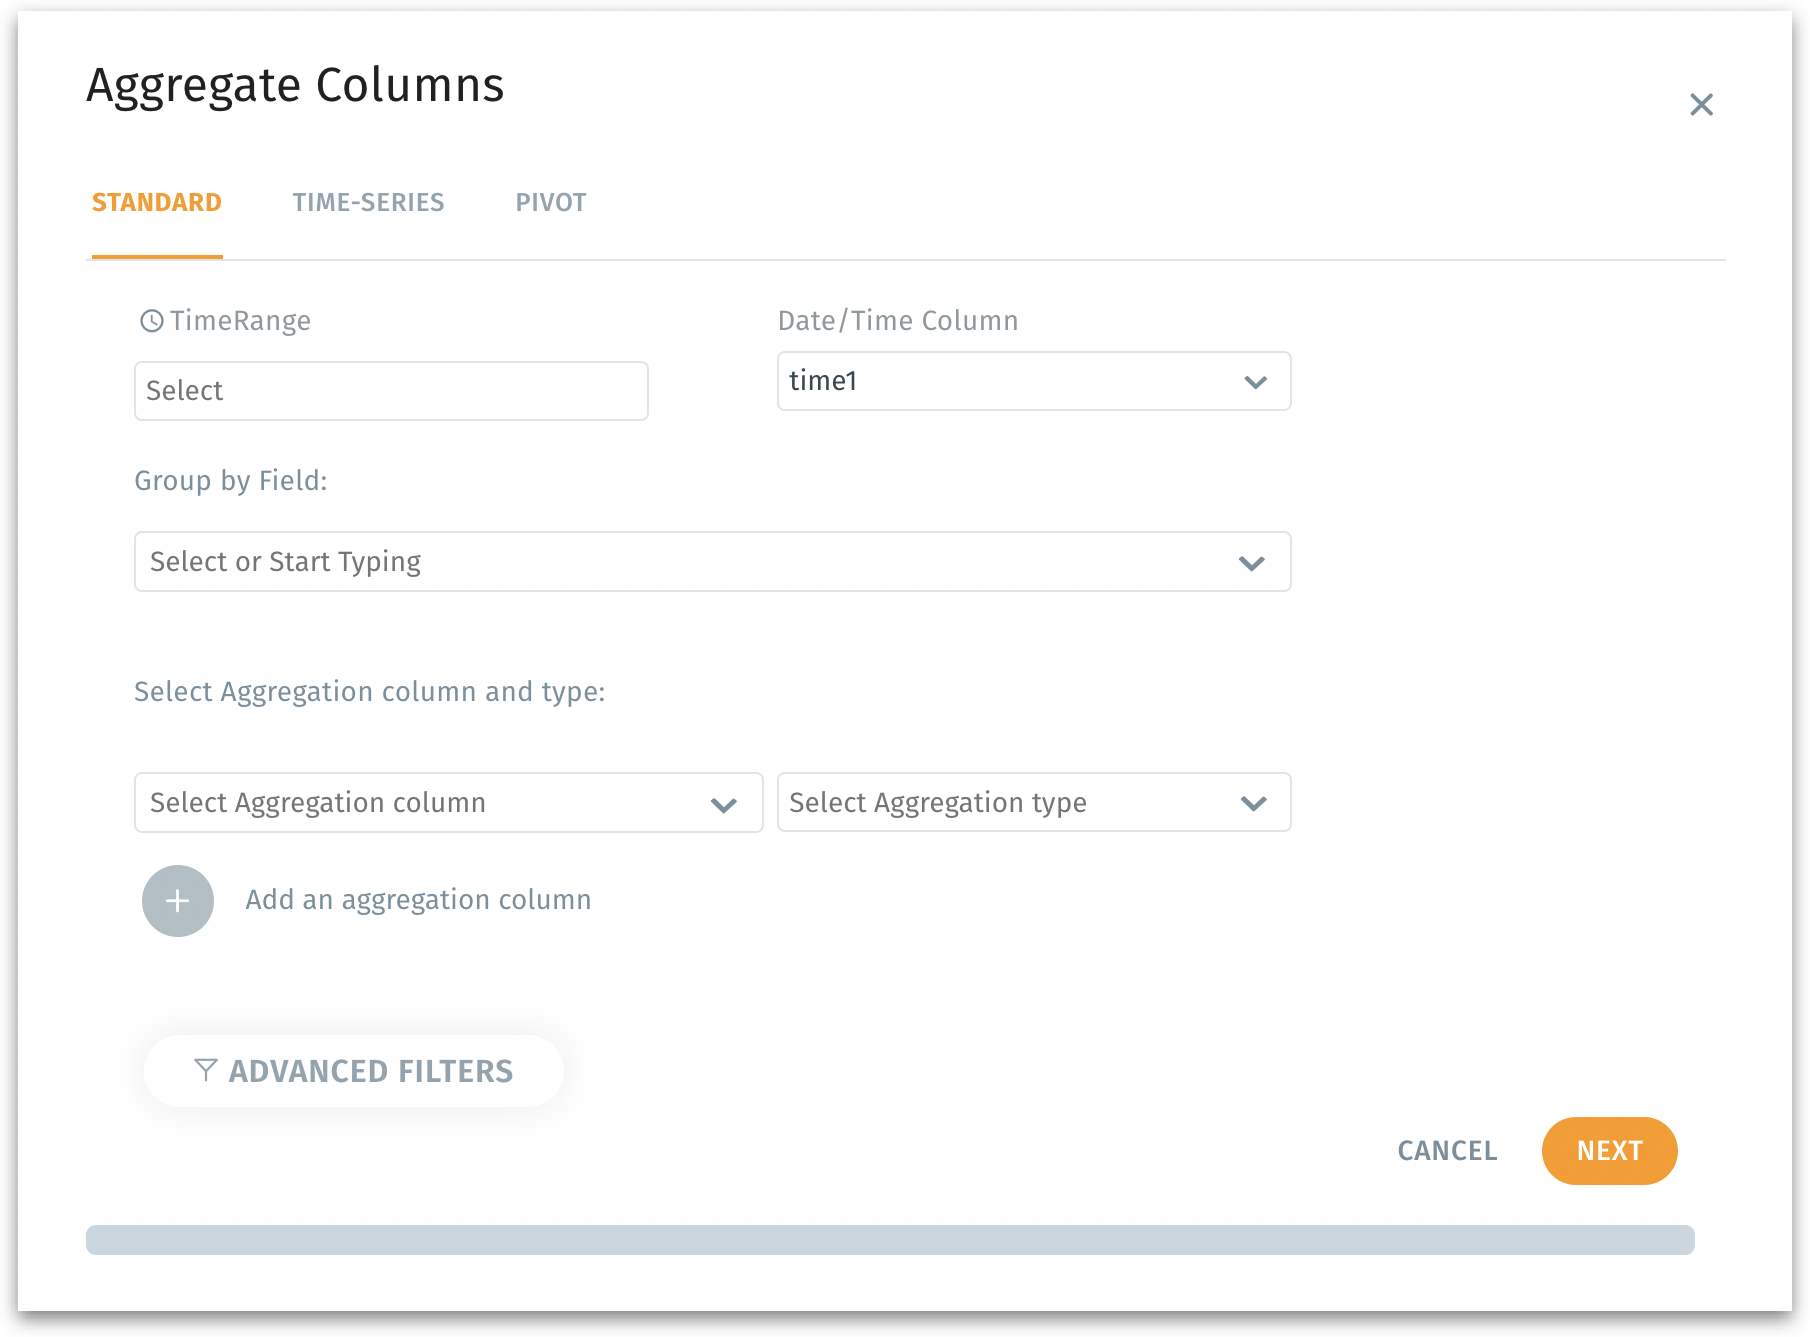
You can find three tabs: Standard, Time series, and Pivot.
Standard tab
Used for basic aggregation of data based on specific fields or time ranges. Ideal when you want to calculate standard metrics (like sum, average, count) for grouped data and get quick summary-level aggregations like total sales per category.
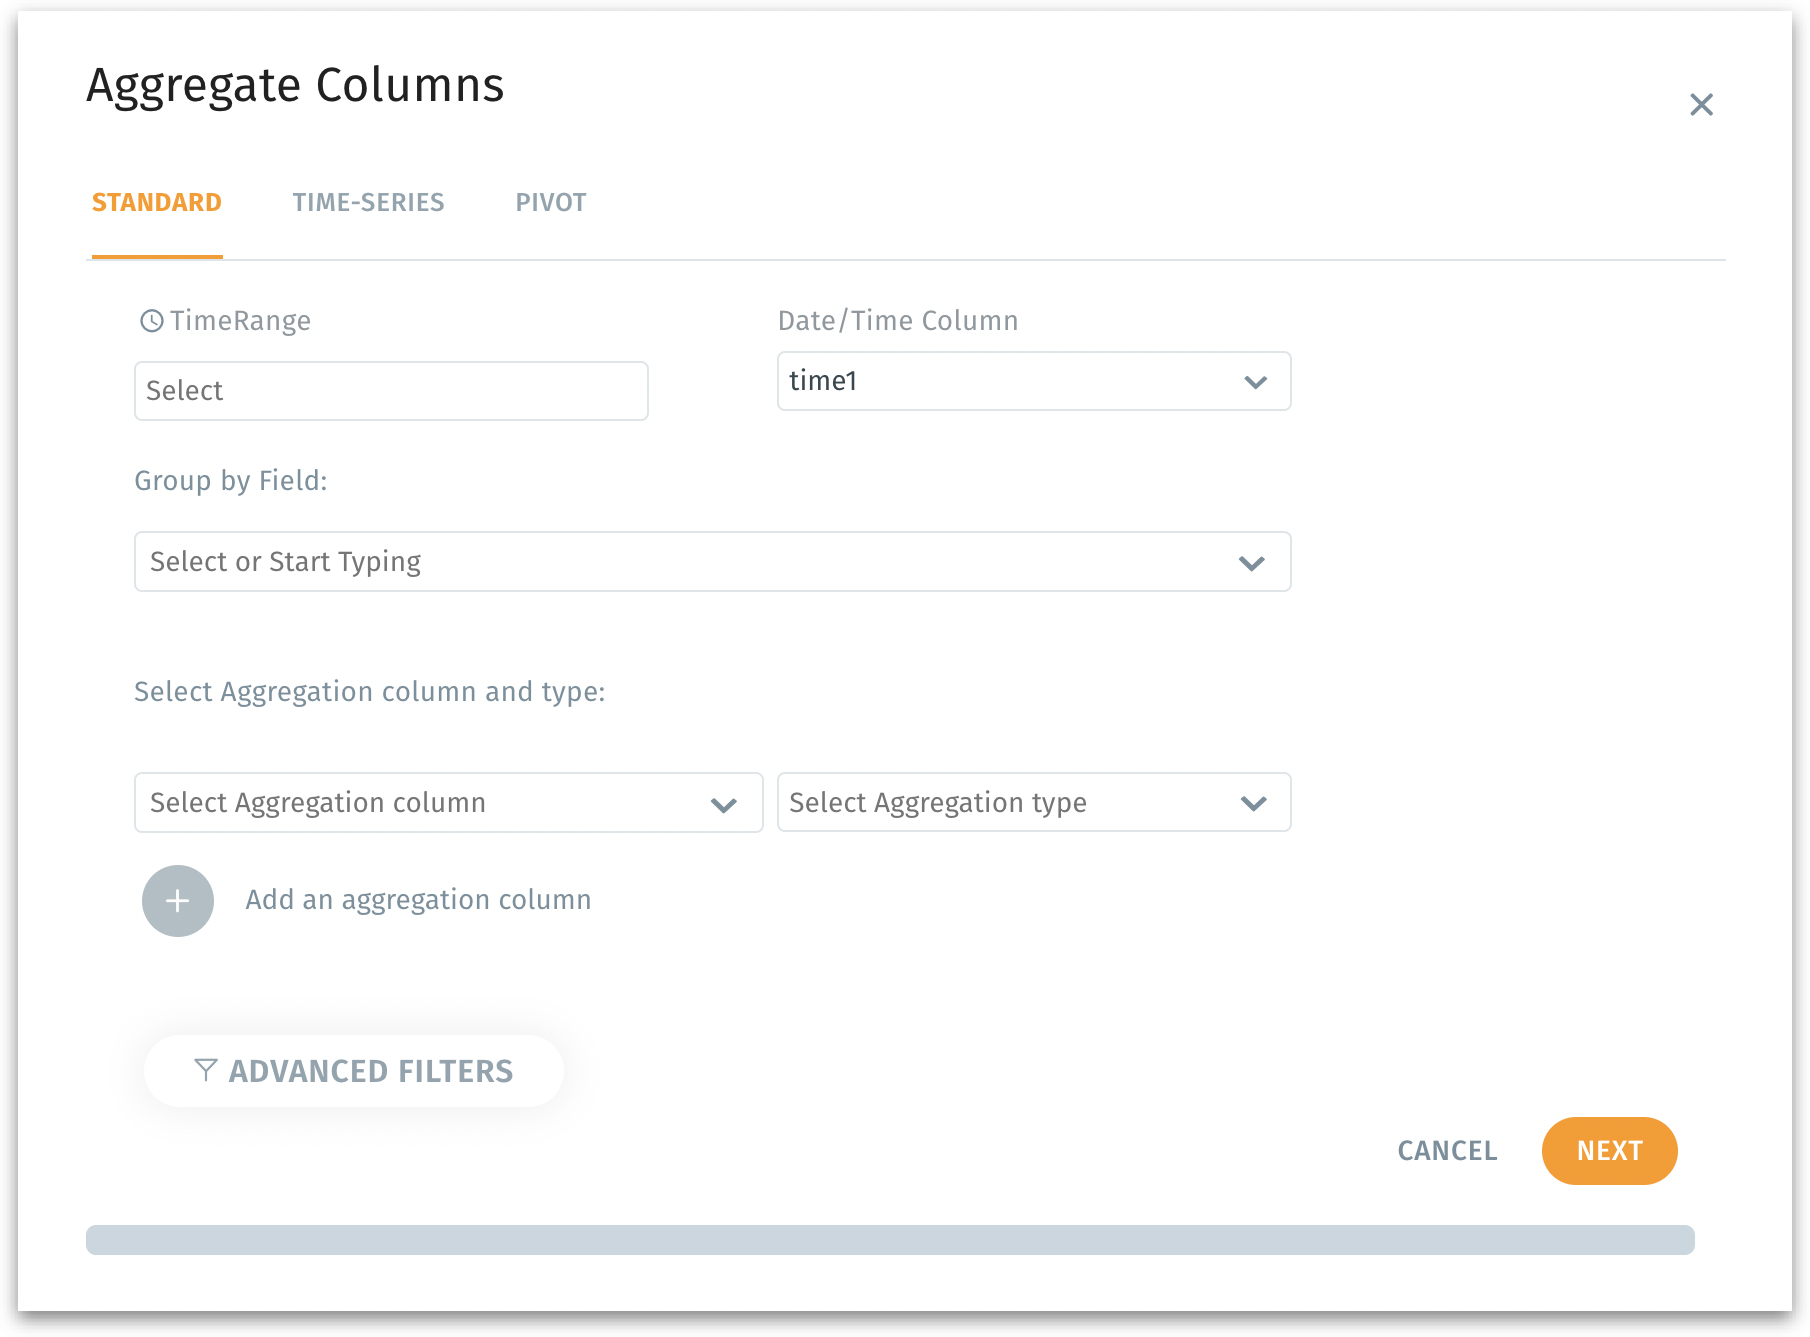
Enter the appropriate values in the following fields:
TimeRange: Select the time range to select the data from the columns.
Date/Time Column: Enter the date and time column that you want to use for the aggregate.
Group by Field: Enter the field name by which you want to group the data in the dataset (e.g., categories, regions).
Select aggregation column and type: Select the column that you want to calculate for the group and the type of aggregation (e.g., sum, average).
(Optional) Add an aggregation column to add additional aggregate column and type.
(Optional) Advanced Filters to add filter condition for your aggregate.
Time Series tab
Time Series tab helps in aggregating data over time intervals to analyze trends. Example: Time-series analysis, forecasting trends, and monitoring performance over time. Ideal when you want to calculate metrics over time, such as daily, weekly, or monthly sales.
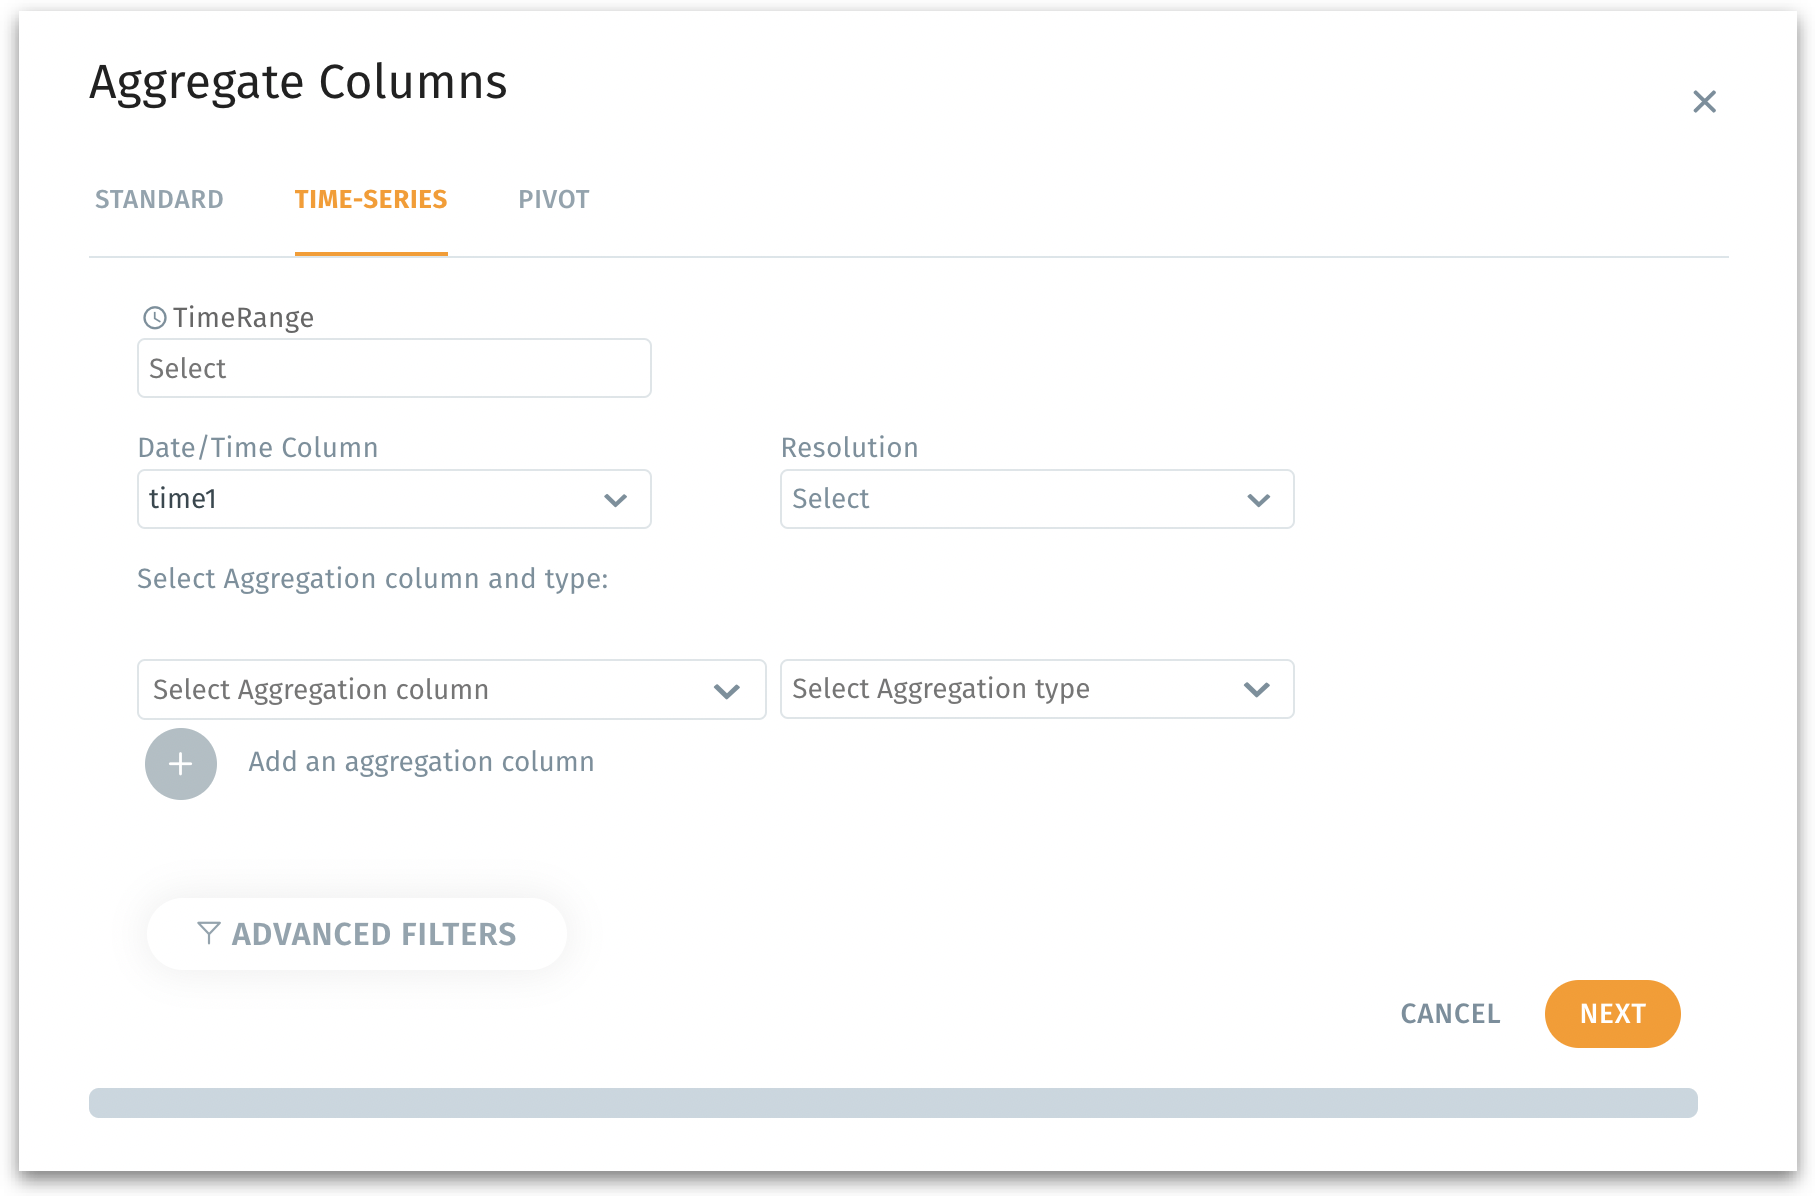
Enter the appropriate values in the following fields:
TimeRange: Select the time range to select the data from the columns.
Date/Time Column: Enter the date and time column that you want to use for the aggregate.
Resolution: Define the time granularity (e.g., daily, weekly, monthly).
Select aggregation column and type: Select the column that you want to calculate for the group and the type of aggregation (e.g., sum, average).
(Optional) Add an aggregation column to add additional aggregate column and type.
(Optional) Advanced Filters to add filter condition for your aggregate.
Pivot tab
Pivot tab enables data pivoting for multi-dimensional summaries. For example, when you want to transform raw data into a tabular format with rows, columns, and aggregate values. Ideal for generating pivot tables for cross-tabulated summaries, such as sales per product per region.
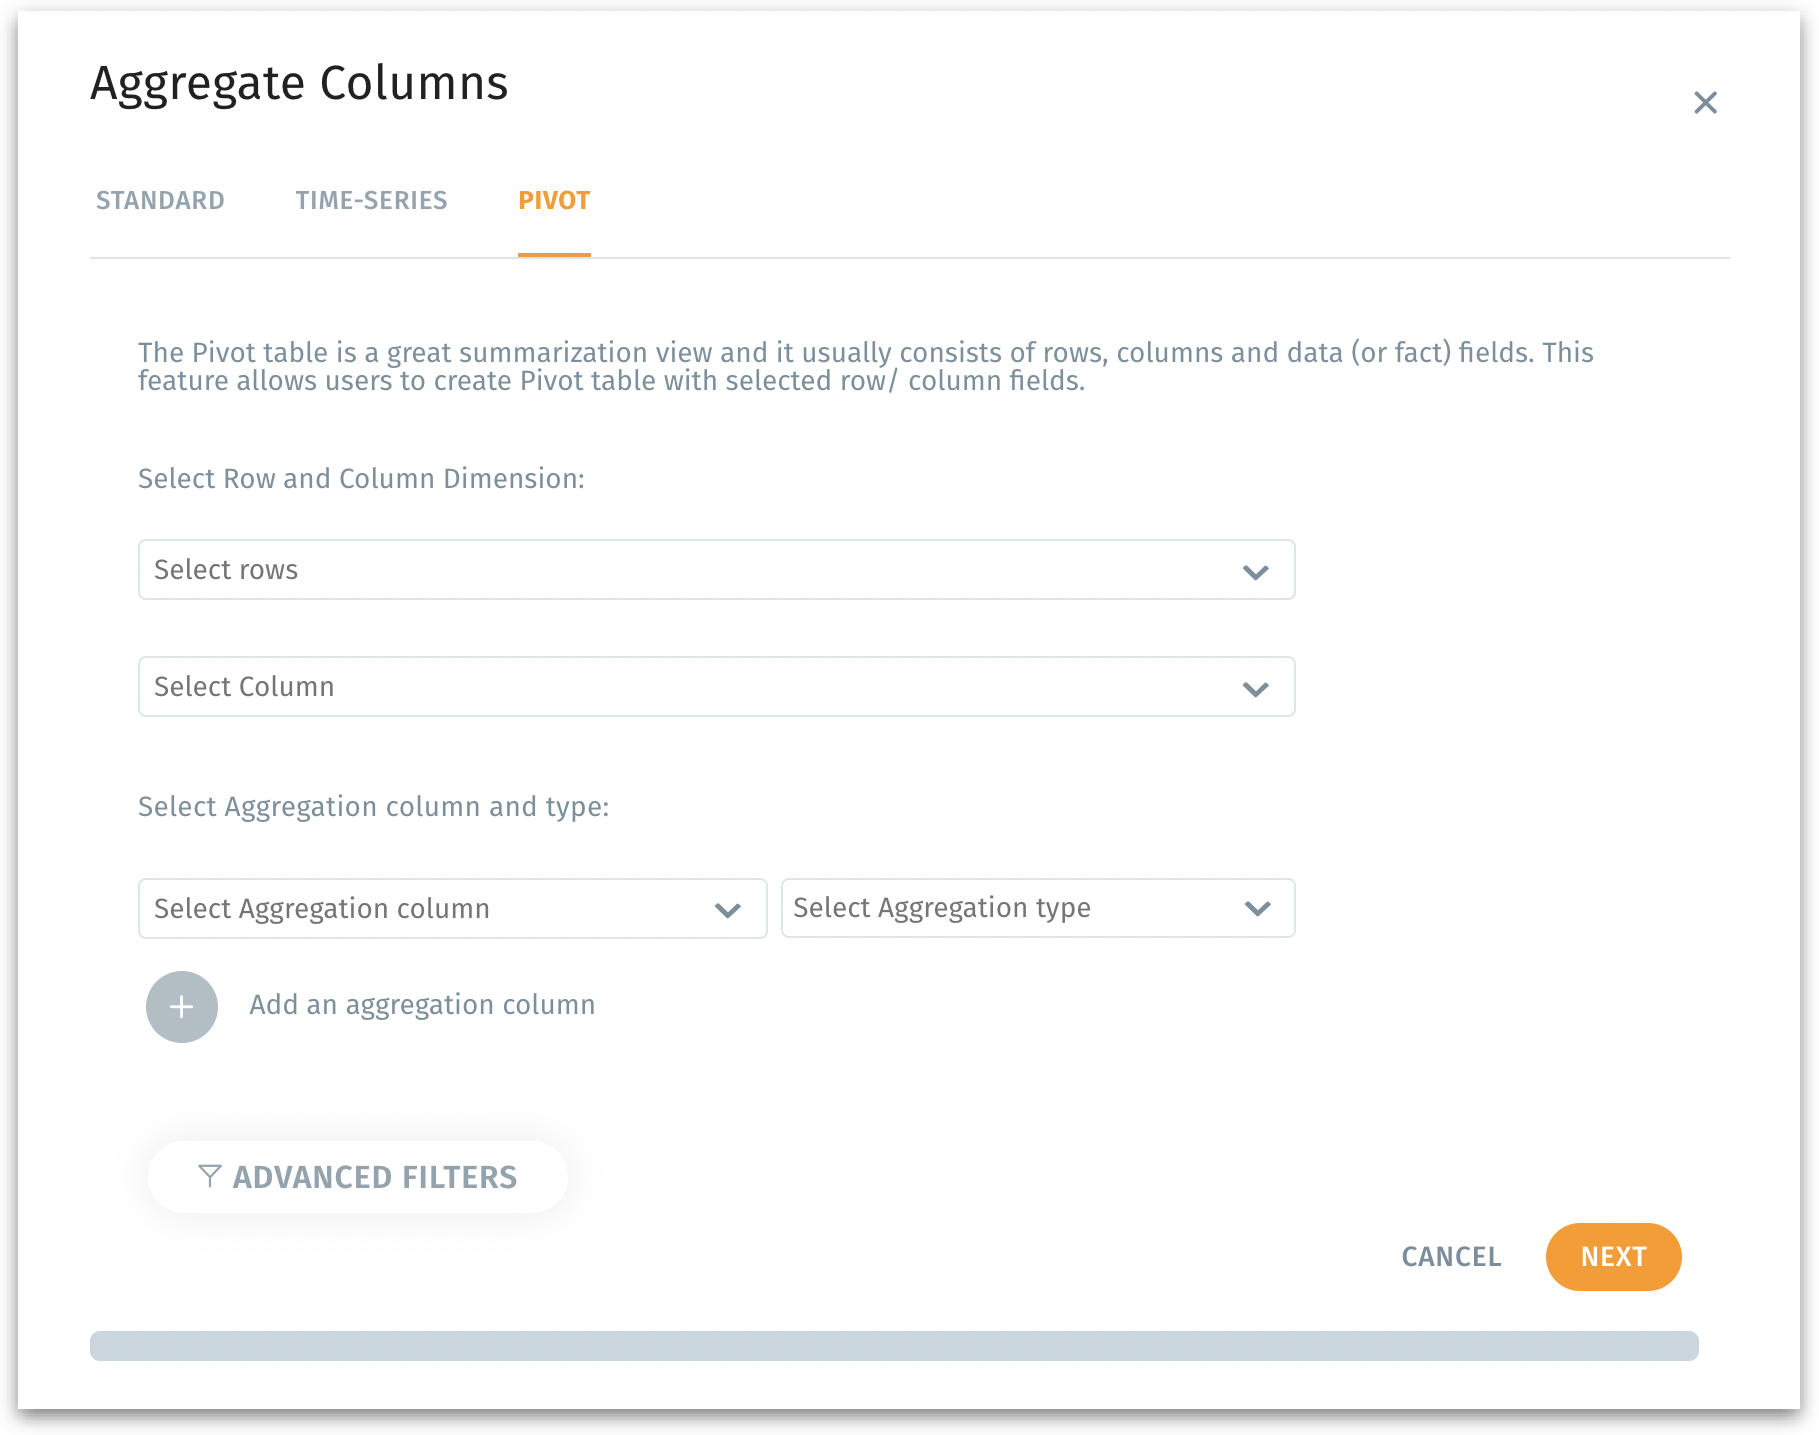
Enter the appropriate values in the following fields:
Select rows and columns: Choose fields to be displayed as rows and columns in the pivot table.
Select aggregation column and type: Select the column that you want to calculate for the group and the type of aggregation (e.g., sum, average).
(Optional) Add an aggregation column to add additional aggregate column and type.
(Optional) Advanced Filters to add filter condition for your aggregate.
Modify the existing dataset or create a new one
Click on Next button to proceed or click on Cancel to discard. The following window will be displayed.
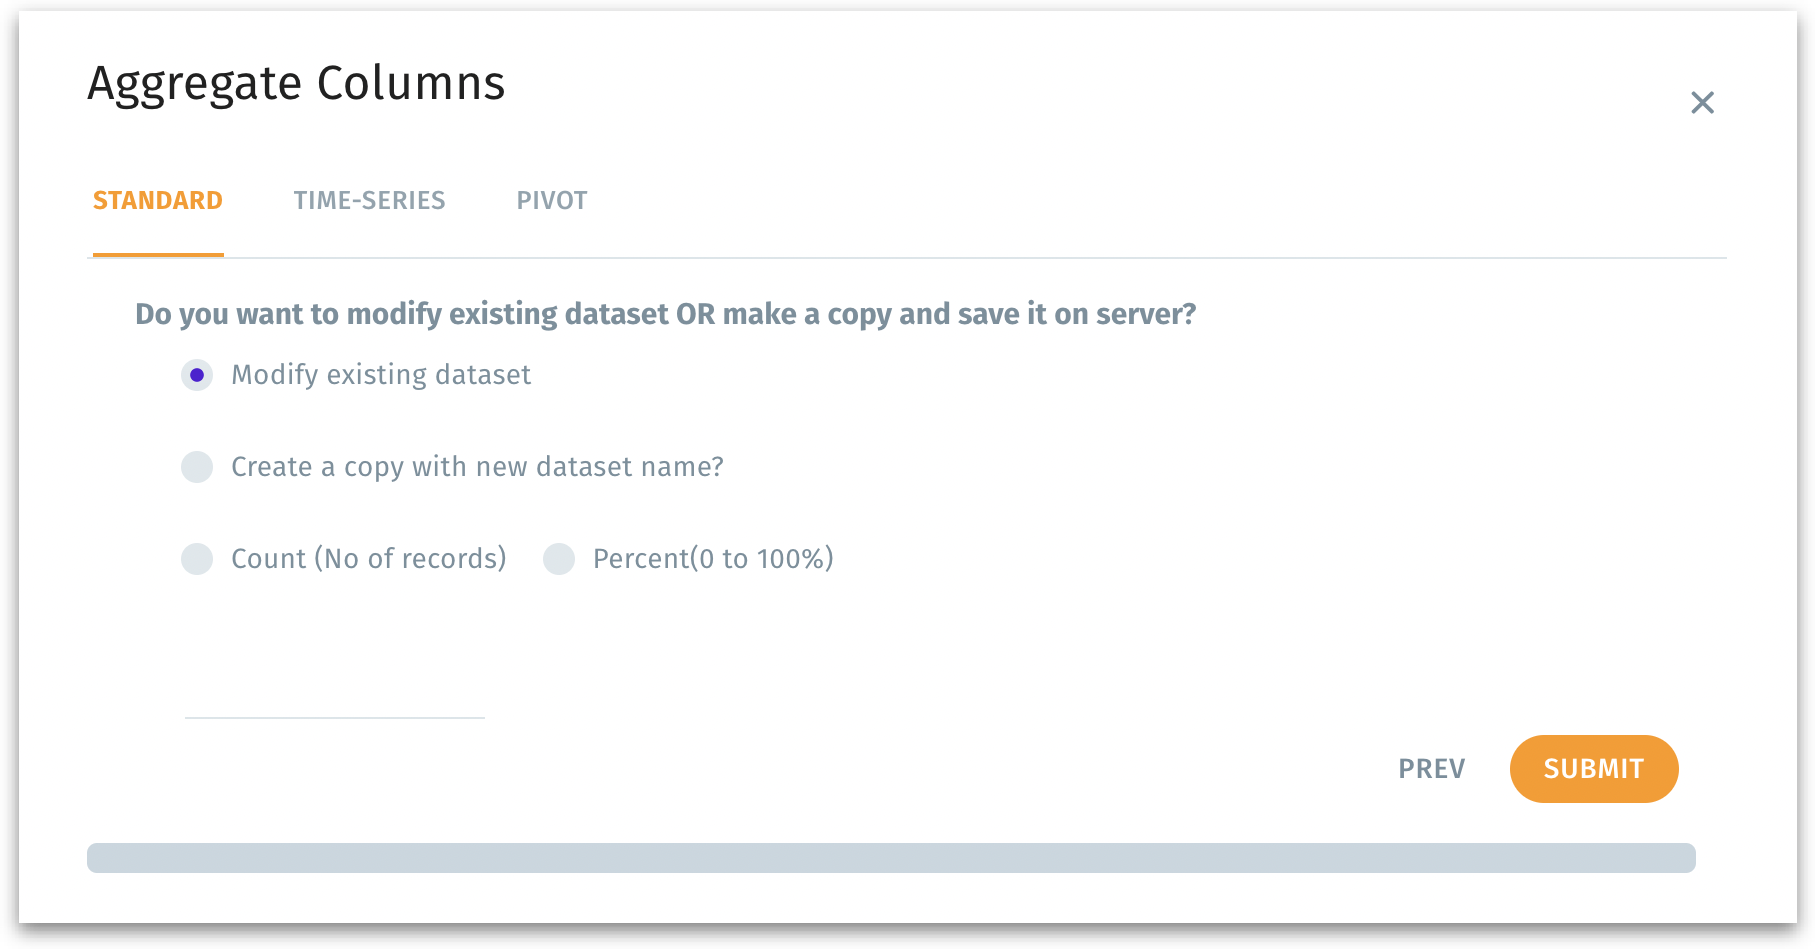
Modify existing dataset: Updates the current dataset directly with the new aggregated columns. Choose this option if you want to overwrite or enhance the existing dataset with the aggregation results.
Create a copy with a new dataset name: Creates a new dataset that includes the aggregation results without altering the original dataset.
Dataset name field: Required if you select the "Create a copy with new dataset name" option. This is where you specify a unique name for the new dataset.
Count (No. of records)
Allows you to specify the number of records to include in the aggregated dataset.
Use this if you only need a subset of records, defined by their count, for analysis or storage.
Percent (0 to 100%)
Lets you define what percentage of the total records should be included in the aggregated dataset.
Use this to sample a proportion of the data for specific use cases like testing or preliminary analysis.
Click on Prev to go back to the previous step or click on Submit to finalize your aggregation selections.
Was this helpful?