Tellius
  • ๐ŸšฉGetting Started
    • ๐Ÿ‘‹Say Hello to Tellius
      • Glossary
      • Tellius 101
      • Navigating around Tellius
      • Guided tours for quick onboarding
    • โšกQuick Start Guides
      • Search
      • Vizpads (Explore)
      • Insights (Discover)
    • โœ…Best Practices
      • Search
      • Vizpads (Explore)
      • Insights (Discover)
      • Predict
      • Data
    • โฌ‡๏ธInitial Setup
      • Tellius architecture
      • System requirements
      • Installation steps for Tellius
      • Customizing Tellius
    • Universal Search
    • ๐Ÿ Tellius Home Page
  • Kaiya
    • โ™Ÿ๏ธUnderstanding AI Agents & Agentic Flows
      • Glossary
      • Composer
      • ๐Ÿ—๏ธTriggering an agentic workflow
      • The art of possible
      • Setting up LLM for Kaiya
    • ๐ŸคนKaiya conversational AI
      • โ“FAQs on Kaiya Conversations
      • Triggering Insights with "Why" questions
      • Mastering Kaiya conversational AI
  • ๐Ÿ”Search
    • ๐Ÿ‘‹Get familiar with our Search interface
    • ๐Ÿค”Understanding Tellius Search
    • ๐Ÿ“Search Guide
    • ๐Ÿš€Executing a search query
      • Selecting a Business View
      • Typing a search query
      • Constructing effective search queries
      • Marketshare queries
    • ๐Ÿ”‘Analyzing search results
      • Understanding search results
      • Search Inspector
      • Time taken to execute a query
      • Interacting with the resulting chart
    • ๐Ÿ“ŠKnow your charts in Tellius
      • Understanding Tellius charts
      • Variations of a chart type
      • Building charts from Configuration pane
      • List of chart-specific fields
      • Adding columns to fields in Configuration pane
      • Absolute and percentage change aggregations
      • Requirements of charts
      • Switching to another chart
      • Formatting charts
      • Advanced Analytics
      • Cumulative line chart
    • ๐Ÿง‘โ€๐ŸซHelp Tellius learn
    • ๐Ÿ•ต๏ธโ€โ™‚๏ธSearch history
    • ๐ŸŽ™๏ธVoice-driven search
    • ๐Ÿ”ดLive Query mode
  • ๐Ÿ“ˆVizpads (Explore)
    • ๐Ÿ™‹Meet Vizpads!
    • ๐Ÿ‘‹Get familiar with our Vizpads
    • #๏ธโƒฃMeasures, dimensions, date columns
    • โœจCreating Vizpads
    • ๐ŸŒApplying global filters
      • Filters in multi-BV Vizpads
      • Filters using common columns
    • ๐Ÿ“ŒApplying local filters
    • ๐Ÿ“…Date picker in filters
      • Customizing the calendar view
    • โœ…Control filters
      • Multi-select list
      • Single-select list
      • Range slider
      • Dropdown list
    • ๐Ÿ‘๏ธActions in View mode
      • Interacting with the charts
    • ๐Ÿ“Actions in Edit mode
      • ๐Ÿ—จ๏ธViz-level actions
    • ๐Ÿ”งAnomaly management for line charts
      • Instance level
      • Vizpad level
      • Chart level
    • โณTime taken to load a chart
      • Instance level
      • Vizpad level
      • Chart level
    • โ™Ÿ๏ธWorking with sample datasets
    • ๐Ÿ”Swapping Business View of charts
      • Swapping only the current Vizpad
      • Swapping multiple objects
      • Configuring the time of swap
    • ๐Ÿค–Explainable AI charts
  • ๐Ÿ’กInsights (Discover)
    • ๐Ÿ‘‹Get familiar with our Insights
    • โ“Understanding the types of Insights
    • ๐Ÿ•ต๏ธโ€โ™‚๏ธDiscovery Insights
    • โž•How to create new Insights
      • ๐Ÿ”›Creating Discovery Insight
      • ๐Ÿ”‘Creating Key Driver Insights
      • ใ€ฐ๏ธCreating Trend Insights
      • ๐Ÿ‘ฏCreating Comparison Insights
    • ๐ŸงฎThe art of selecting columns for Insights
      • โžก๏ธHow to include/exclude columns?
  • ๐Ÿ”ขData
    • ๐Ÿ‘‹Get familiar with our Data module
    • ๐Ÿฅ‚Connect
    • ๐ŸชนCreate new datasource
      • Connecting to Oracle database
      • Connecting to MySQL database
      • Connecting to MS SQL database
      • Connecting to Postgres SQL database
      • Connecting to Teradata
      • Connecting to Redshift
      • Connecting to Hive
      • Connecting to Azure Blob Storage
      • Connecting to Spark SQL
      • Connecting to generic JDBC
      • Connecting to Salesforce
      • Connecting to Google cloud SQL
        • Connecting to a PostgreSQL cloud SQL instance
        • Connecting to an MSSQL cloud SQL instance
        • Connecting to a MySQL Cloud SQL Instance
      • Connecting to Amazon S3
      • Connecting to Google BigQuery
        • Steps to connect to a Google BigQuery database
      • Connecting to Snowflake
        • OAuth support for Snowflake
        • Integrating Snowflake with Azure AD via OAuth
        • Integrating Snowflake with Okta via OAuth
        • Azure PrivateLink
        • AWS PrivateLink
        • Best practices
      • Connecting to Databricks
      • Connecting to Databricks Delta Lake
      • Connecting to an AlloyDB Cluster
      • Connecting to HDFS
      • Connecting to Looker SQL Interface
      • Loading Excel sheets
      • ๐ŸšงUnderstanding partitioning your data
    • โณTime-to-Live (TTL) and Caching
    • ๐ŸŒทRefreshing a datasource
    • ๐ŸชบManaging your datasets
      • Swapping datasources
    • ๐ŸฃPreparing your datasets
      • ๐ŸคพActions that can be done on a dataset
      • Data Pipeline
      • SQL code snippets
      • โœ๏ธWriteback window
      • ๐ŸงฉEditing Prepare โ†’ Data
      • Handling null or mismatched values
      • Metadata view
      • List of icons and their actions
        • Functions
        • SQL Transform
        • Python Transform
        • Standard Aggregation
        • Creating Hierarchies
      • Dataset Scripting
      • Fusioning your datasets
      • Scheduling refresh for datasets
    • ๐ŸฅPreparing your Business Views
      • ๐ŸŒŸCreate a new Business View
      • Creating calculated columns
      • Creating dynamic parameters
      • Scheduling refresh for Business Views
      • Setting up custom calendars
    • Tellius Engine: Comparison of In-Memory vs. Live Mode
  • Feed
    • ๐Ÿ“ฉWhat is a Feed in Tellius?
    • โ—Alerts on the detection of anomalies
    • ๐Ÿ“ฅViewing and deleting metrics
    • ๐Ÿ–ฒ๏ธTrack a new metric
  • Assistant
    • ๐Ÿ’Introducing Tellius Assistant
    • ๐ŸŽคVoice-based Assistant
    • ๐Ÿ’ฌInteracting with Assistant
    • โ†–๏ธSelecting Business View
  • Embedding Tellius
    • What you should know before embedding
    • Embedding URL
      • ๐Ÿ“ŠEmbedding Vizpads
        • Apply and delete filters
        • Vizpad-related actionTypes
        • Edit, save, and share a Vizpad
        • Keep, remove, drill sections
        • Adding a Viz to a Vizpad
        • Row-level policy filters
      • ๐Ÿ’กEmbedding Insights
        • Creating and Viewing Insights
      • ๐Ÿ”ŽEmbedding Search
        • Search query execution
      • Embedding Assistant
      • ๐Ÿช„Embedding Kaiya
      • Embedding Feed
  • API
    • Insights APIs
    • Search APIs
    • Authentication API (Login API)
  • โœจWhat's New
    • Release 5.4
      • Patch 5.4.0.x
    • Release 5.3
      • Patch 5.3.1
      • Patch 5.3.2
      • Patch 5.3.3
    • Release 5.2
      • Patch 5.2.1
      • Patch 5.2.2
    • Release 5.1
      • Patch 5.1.1
      • Patch 5.1.2
      • Patch 5.1.3
    • Release 5.0
      • Patch 5.0.1
      • Patch 5.0.2
      • Patch 5.0.3
      • Patch 5.0.4
      • Patch 5.0.5
    • Release 4.3 (Fall 2023)
      • Patch 4.3.1
      • Patch 4.3.2
      • Patch 4.3.3
      • Patch 4.3.4
    • Release 4.2
      • Patch 4.2.1
      • Patch 4.2.2
      • Patch 4.2.3
      • Patch 4.2.4
      • Patch 4.2.5
      • Patch 4.2.6
      • Patch 4.2.7
    • Release 4.1
      • Patch 4.1.1
      • Patch 4.1.2
      • Patch 4.1.3
      • Patch 4.1.4
      • Patch 4.1.5
    • Release 4.0
Powered by GitBook

ยฉ 2025 Tellius

On this page
  • ๐Ÿš€ New features
  • Introducing Explainable AI charts in Vizpads
  • Snowflake OAuth with Microsoft Azure AD and Okta support
  • Customizable Tellius interface
  • Configurable Cache TTL
  • Reset Vizpads in View Mode
  • Selecting Region in Redshift Connectors
  • ๐Ÿ› ๏ธ Minor fixes

Was this helpful?

Export as PDF
  1. What's New
  2. Release 4.2

Patch 4.2.5

PreviousPatch 4.2.4NextPatch 4.2.6

Last updated 3 days ago

Was this helpful?

We're thrilled to introduce the latest updates to Tellius! In version 4.2.5, we're delivering a set of features aimed at increasing customization, improving data connectivity, and enhancing user experience. From new OAuth integrations to advanced customization options, this release focuses on making the platform more flexible for our users. Here are the key updates:

๐Ÿš€ New features

Introducing Explainable AI charts in Vizpads

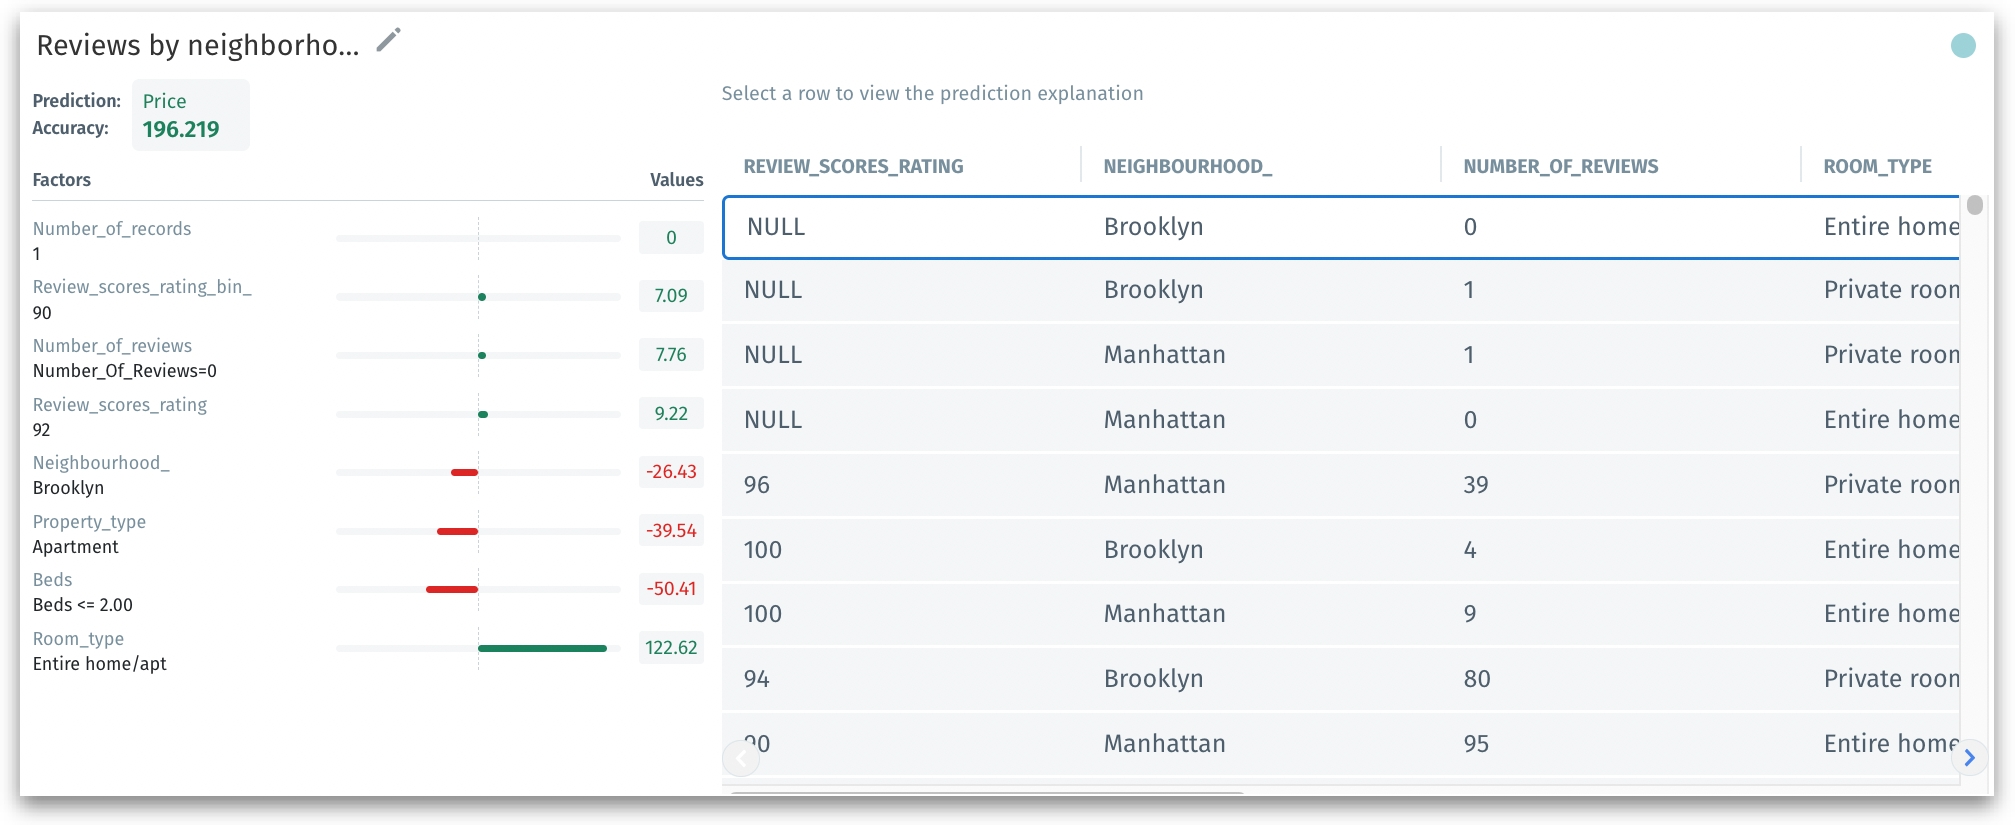
In Vizpads, we have introduced explainable AI charts that allow users to easily visualize and understand the factors influencing their machine learning model's predictions. It offers insights into the underlying reasons behind each prediction, ensuring users can make more informed decisions and better mitigate potential risks. This chart is composed of two essential sections: a table displaying all columns in the Business View with an option to select specific rows, and a detailed breakdown of the factors influencing the predicted value for the chosen row.

Explainable AI chart

Snowflake OAuth with Microsoft Azure AD and Okta support

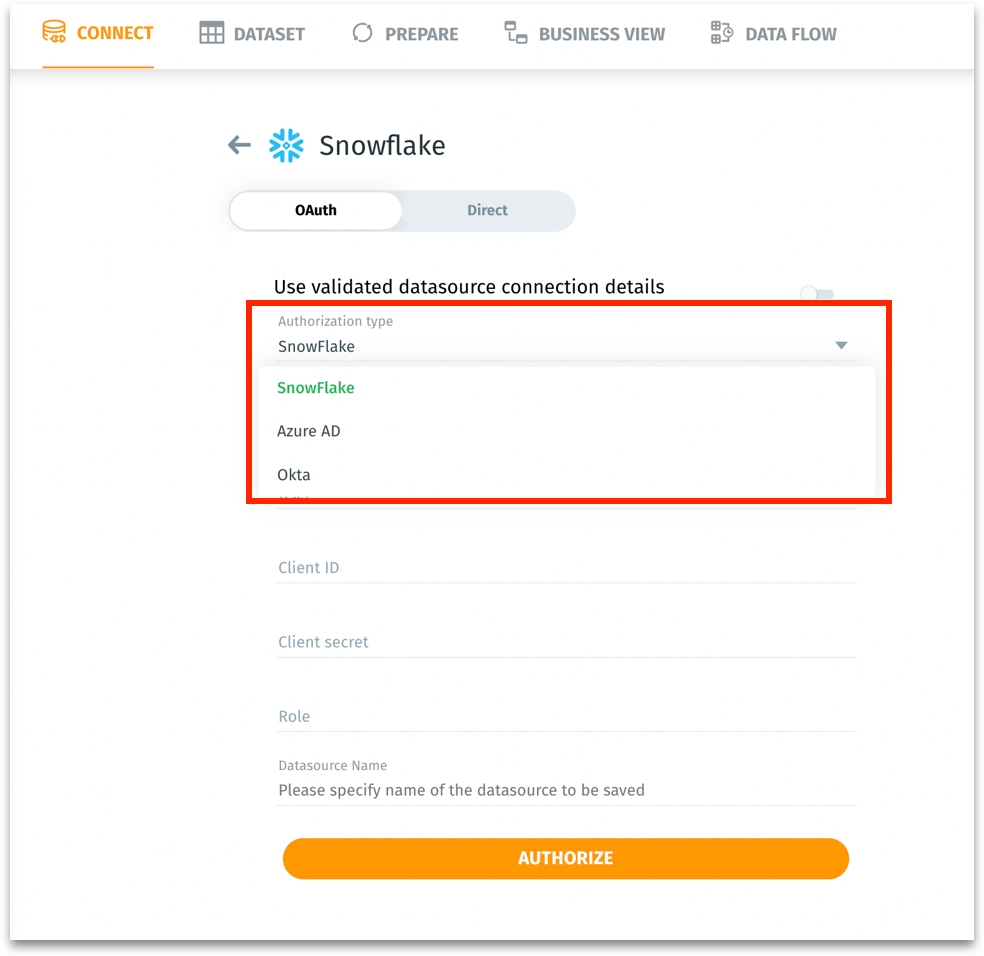
With the latest release, users can now leverage Azure AD or Okta as external token providers for Snowflake. In addition to connecting directly, Tellius has expanded the Snowflake OAuth connectivity to support Microsoft AD and Okta. Upon expiration (after 90 days), Tellius will display a re-authentication prompt when a user accesses a Vizpad sourced from Snowflake or queries a Business View using a Snowflake dataset.

Customizable Tellius interface

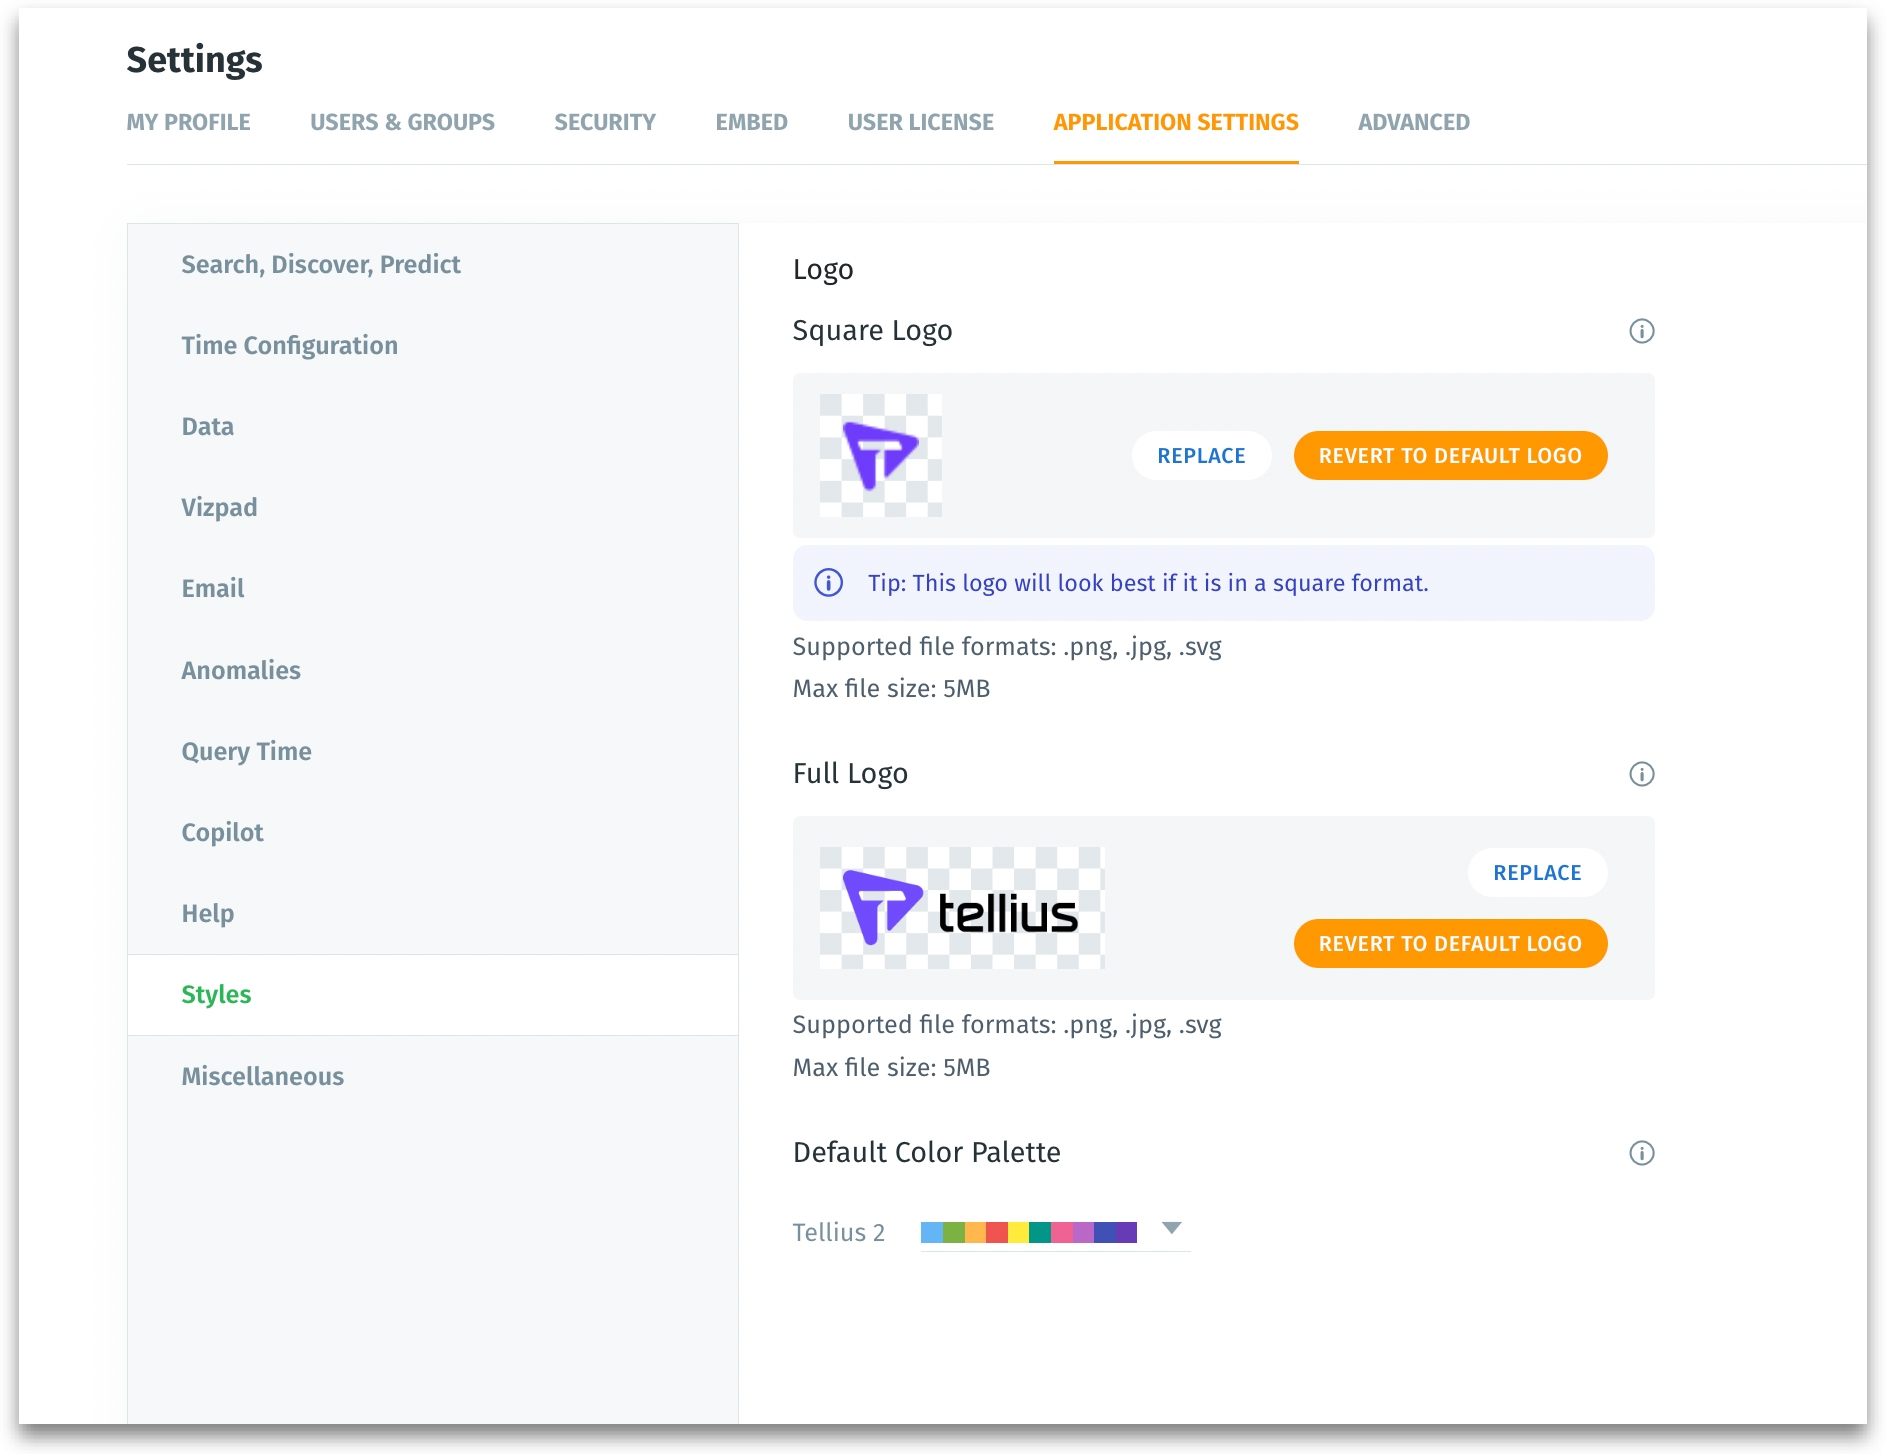
Users can now replace the default Tellius logo for a more customized experience. Under Settings โ†’ Application Settings, two types of logos (square-shaped and rectangular images) can be uploaded to be displayed in multiple places across Tellius. Additionally, users can choose the required color palette to be reflected across the platform.

Configurable Cache TTL

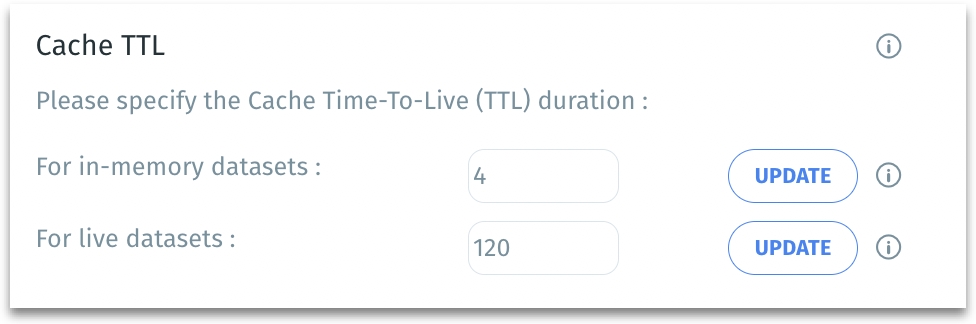
4.2.5 introduces a new feature that allows for direct configuration of the cache Time-to-Live (TTL) for live and non-live data sources from Settings โ†’ Application Settings. The TTL value specifies the duration for which the data remains in the cache before it's considered outdated and needs to be refreshed. By adjusting the cache duration to specific needs, users can optimize data retrieval, ensuring faster access and improved performance.

Reset Vizpads in View Mode

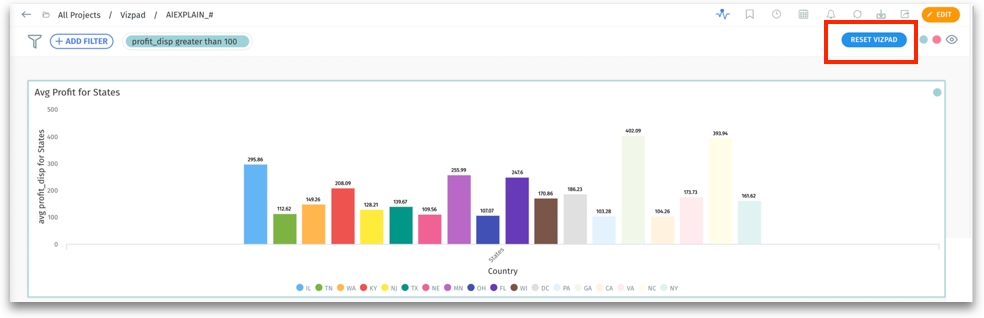
If a viewer inadvertently alters or removes filters, they can now effortlessly return the chart to its original state with the Reset Vizpad button in view-only mode. Upon using the Reset feature, the chart will instantly refresh, restoring the default filters. A confirmation message will be displayed informing users of the successful reset.

Selecting Region in Redshift Connectors

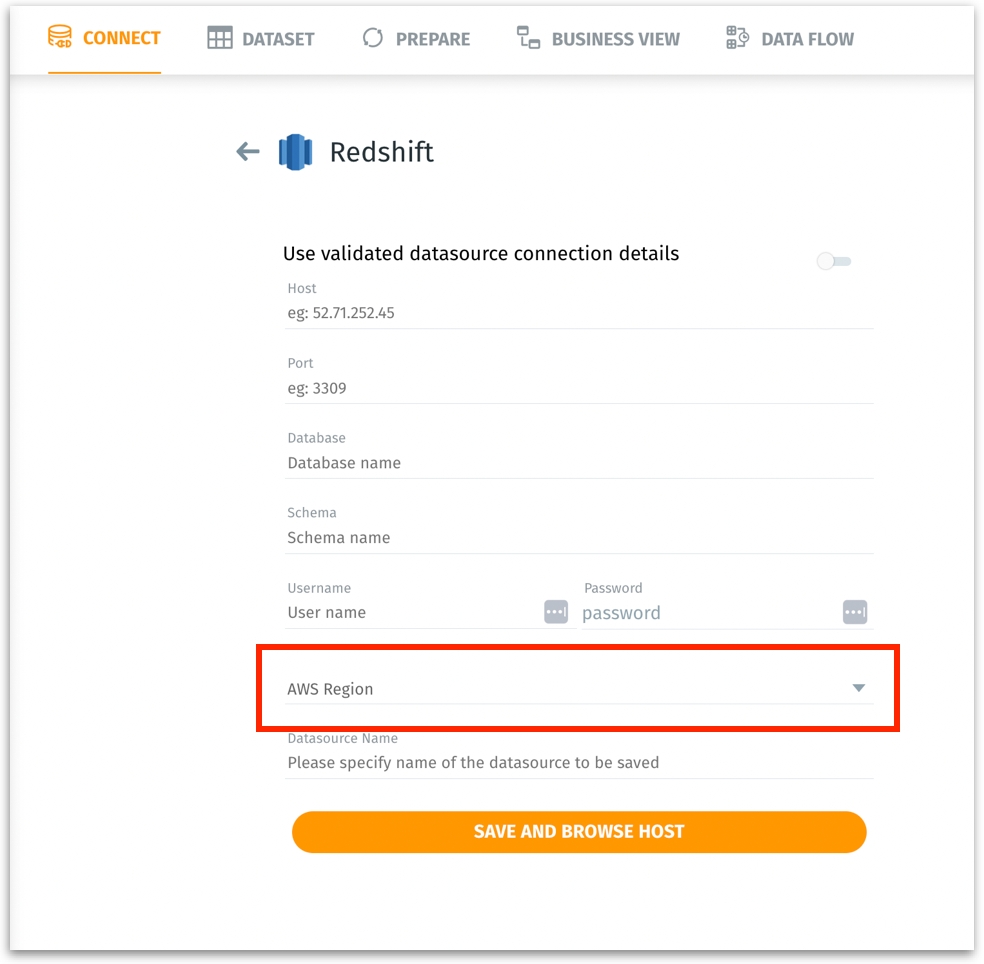
Users can now choose the desired region for their Redshift connector, thereby obtaining better data locality and response times.

๐Ÿ› ๏ธ Minor fixes

  1. Enhanced validation to ensure SQL/Python in Tellius aligns with OpenAI standards.

  2. Fixed an issue where the Year Over Year (YOY) chart would not reset to its original state after selecting the "Reset Vizpad" option.

  3. Improved error messaging when Vizpad fails to save, especially due to server downtime or connectivity issues.

  4. Resolved an issue preventing users from running search discoveries directly from the chart interaction menu.

  5. The issues with display names missing in Insights popups, conditional formatting, and during Feed creation, ML, and Insight creation have been resolved.

  6. The issues with the Undo functionality, Continue prompt, and duplicate columns while editing calculated columns have been fixed.

  7. Rectified the issue of overlapping legends when dual axes are enabled in horizontal bar charts.

  8. Fixed the column search functionality within Vizpad filter popups.

  9. Addressed the UX issues related to resizing 2x2 control viz.

  10. Corrected an overlap issue within the Vizpad filter dropdown for Windows users.

  11. Improved the display of tooltips and labels of 3x3 viz.

  12. Fixed an issue affecting filter popup positions for smaller visualizations on the first column.

  13. Ensured scrollbars are visible and functional across platforms, especially for Windows users.

  14. Addressed an issue hiding titles in the 2x2 design format of KPI charts.

  15. Optimized dropdown appearance of the Search page when displaying fewer Business Views, eliminating unsightly whitespace.

  16. Enhanced the CSS styling of the Business View swap info banner.

  17. Fixed the positioning of tooltips within the Share Project popup.

  18. Ensured accurate value updates in control viz after a Business View swap operation.

  19. Resolved discrepancies in value and operator updates for cloned sliders.

  20. In Vizpads, improved responsiveness and reduced lag when dragging and dropping columns from Business View to chart configurations.

  21. Fixed the inconsistency between Edit and View modes of Vizpads, after resetting filters.

  22. The issue with incorrect reset of Vizpads charts after deleting control filters and global filters has been resolved.

  23. Improved tooltip positioning for longer text elements in control viz.

  24. Fixed an issue causing the active visualization to reset to the first option after updating control vizs.

  25. Rectified a bug causing the loss of calculated columns and column groups upon publishing a Business View.

  26. Resolved an issue with incorrect columns being displayed during Point-N-Click creation in Projects.

  27. For Business View swap operations, streamlined user redirection from Notifications.

  28. The issue with resetting feed filter values after creating feed subscriptions has been resolved.

  29. In Vizpads, enhanced tooltip displays to prevent them from overflowing or being clipped out in table content.

OAuth support for Snowflake
Customizable logo and color palette
Cache TTL
Ability to reset Vizpads
Region selection in Redshift
โœจ