
🗝️Triggering an agentic workflow
Learn how Kaiya triggers agentic workflows—from matching user queries to triggers, orchestrating AI agents, executing steps, and delivering structured insights.
Here, we break down the entire agentic flow—from when a user types a query to when the workflow is executed and completed using AI agents in Tellius. It applies universally to all Agentic Workflows regardless of use case (e.g., revenue analysis, product discontinuation, churn prediction etc.).
To trigger a user-defined workflow or let Kaiya plan and automate the analysis step by step, click the Deep Insight button.
1. User initiates query
When the user interacts with Kaiya by entering a natural language query in the chat interface, it is evaluated in real time against a list of triggers configured for published agentic flows.
Each agentic flow contains one or more trigger phrases defined during workflow creation in Composer. These triggers allow Kaiya to intelligently map user input to the correct workflow, even if the phrasing is not exact. Trigger variations are supported, meaning you can ask a question in different ways, and Kaiya will still recognize the intent.
2. Kaiya maps query to a trigger
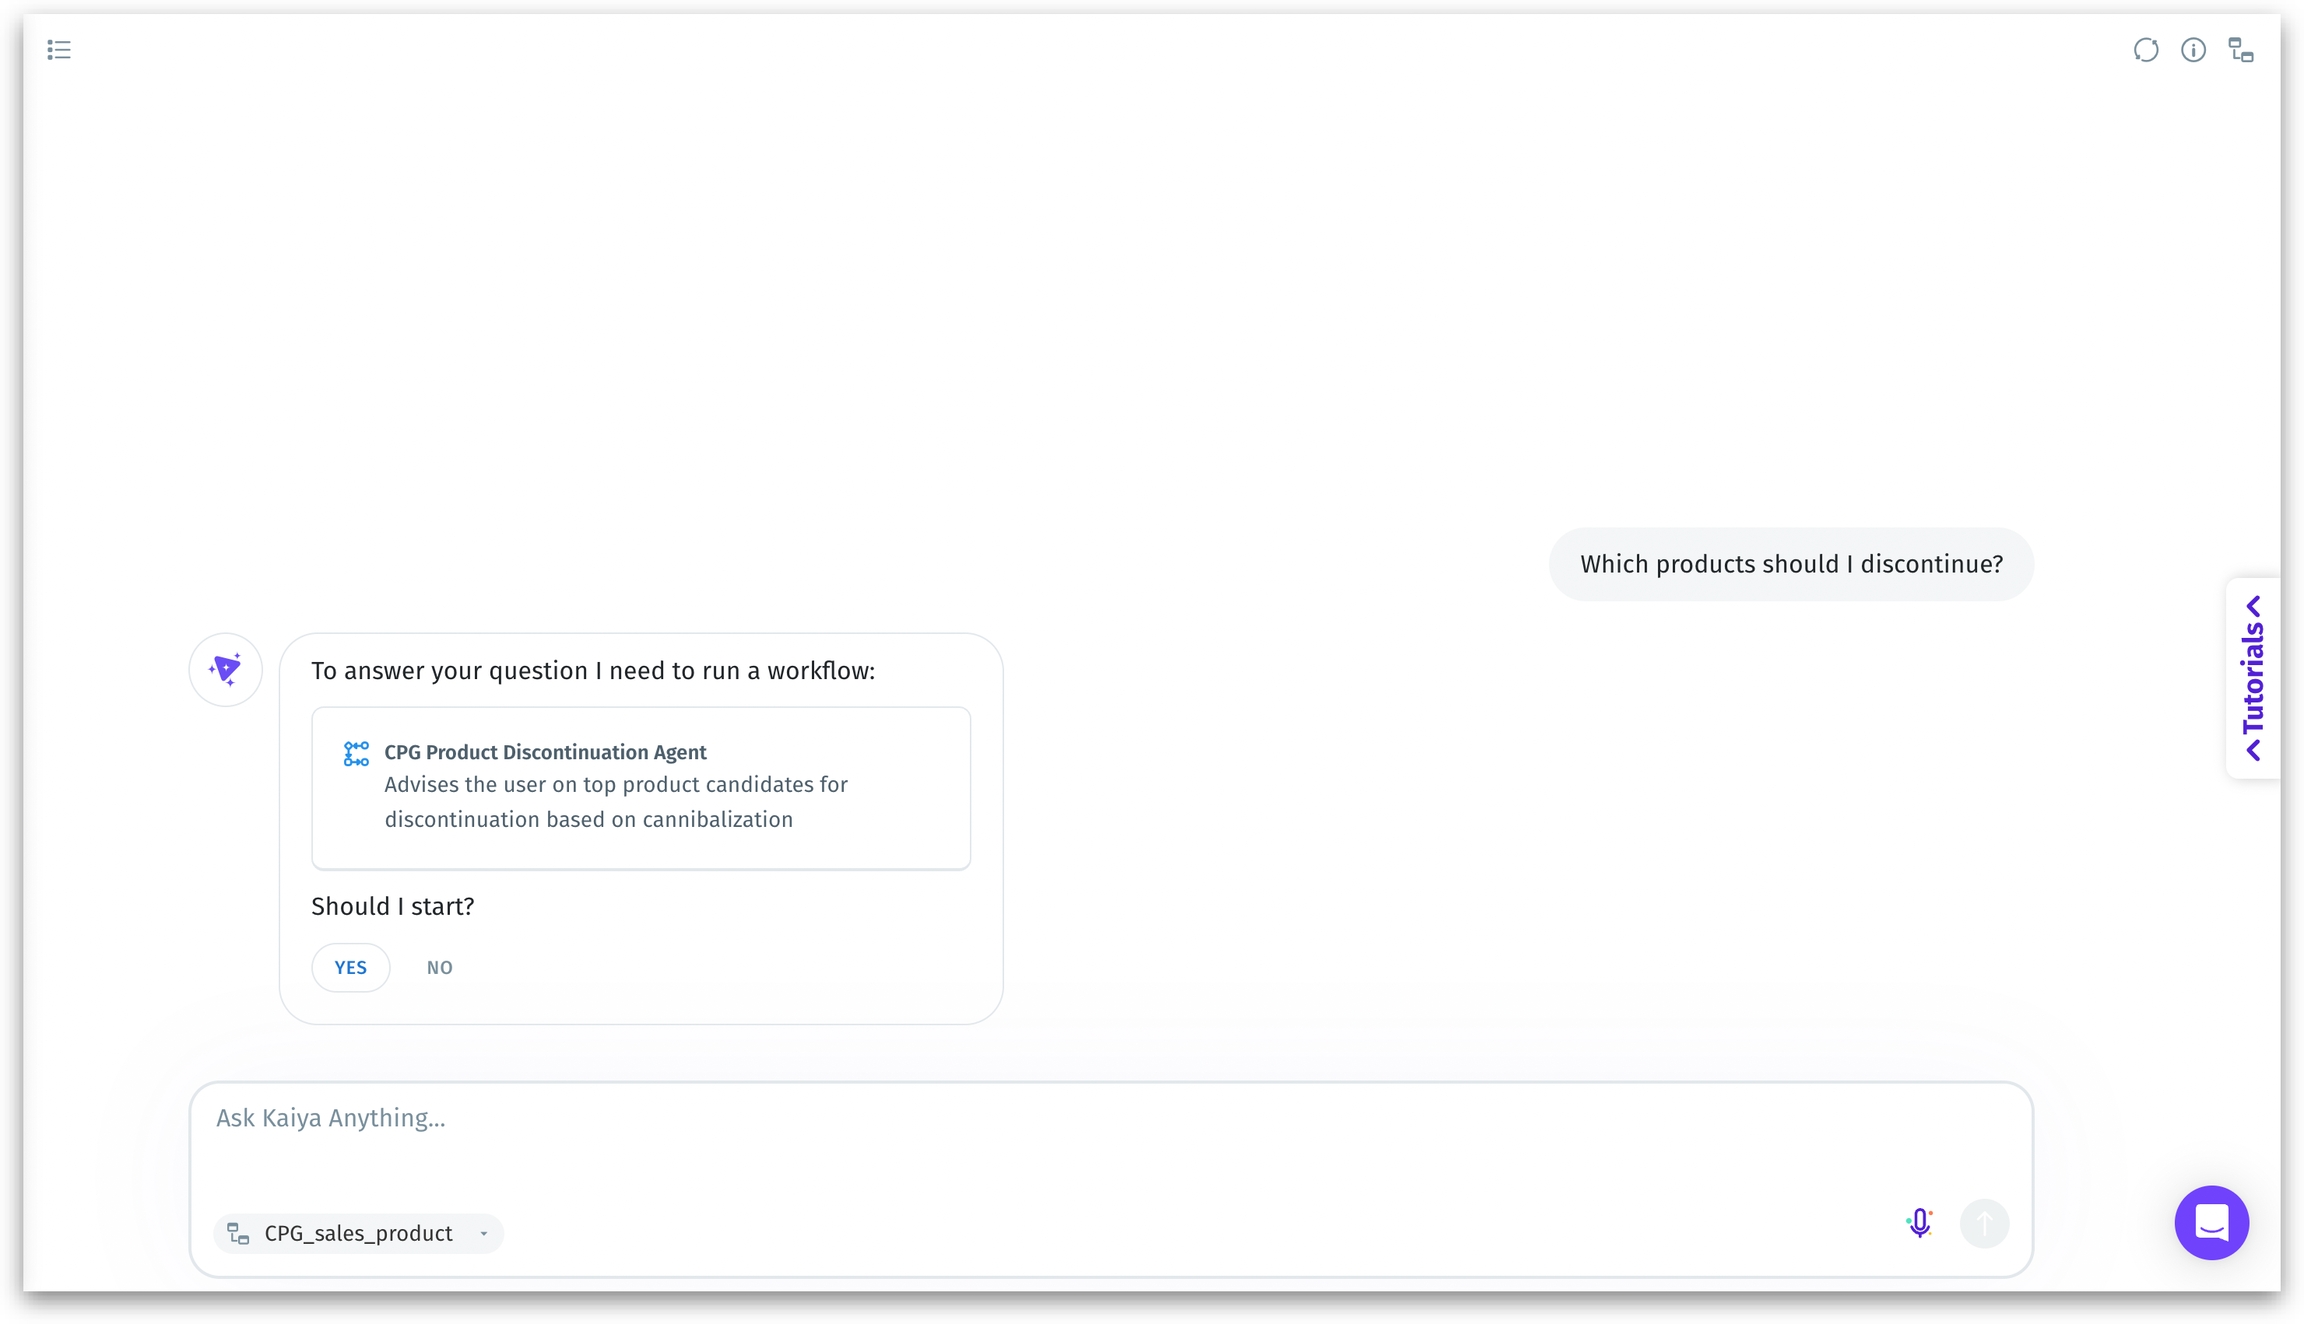
If a match is found, Kaiya responds with the name and description of the matching agentic flow, and prompts user confirmation to initiate the workflow execution. This user confirmation ensures control and transparency before any backend processing begins.
Choose “Yes” to continue, else select “No” to abort the workflow exection.
3. Workflow initialization
Upon confirmation, Kaiya activates the Planner Agent. The Planner Agent's job is to:
Interpret the workflow's objective
Break it into logical, executable steps
Identify which agents need to be involved
Sequence these agents correctly
The Planner Agent acts as the orchestrator or mission control of the entire agentic flow. It ensures the right agents are activated at the right time in the right order.
4. Squad of AI Agents
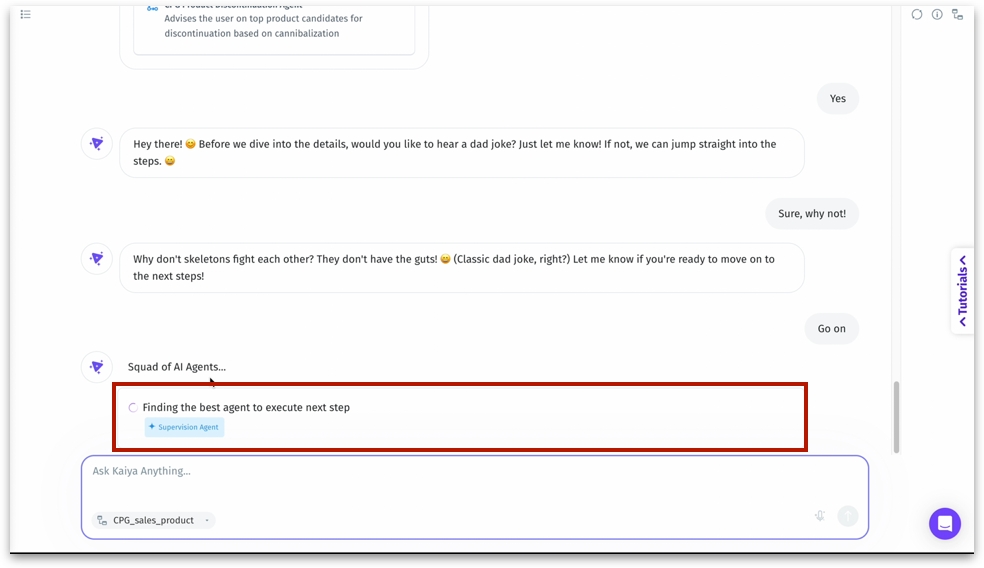
A message appears as follows: “Squad of AI Agents... Finding the best agent to execute next step.” This indicates that Kaiya is identifying and activating the most suitable agent for the task at hand. The agents activated depend entirely on the workflow steps defined in Composer. Agents begin executing each workflow step , using the logic defined in Composer. Commonly involved agents include:
Agent Name
Role
Validation Agent
Checks query structure, permissions, and data readiness
Planner Agent
Breaks down requests, assigns agent tasks, sequences execution
Data Prep Agent
Filters, joins, and loads relevant data from selected Business Views
Visualization Agent
Generates appropriate visuals (charts, tables, graphs)
Insights Agent
Performs root cause analysis, trend detection, and pattern mining
Summary Agent
Converts insights into plain-language narratives and summaries
Knowledge Graph Agent
Maps relationships, finds entity connections, powers recommendations
Each of these agents has a specific, modular purpose, and they are invoked only if required by the defined step logic.
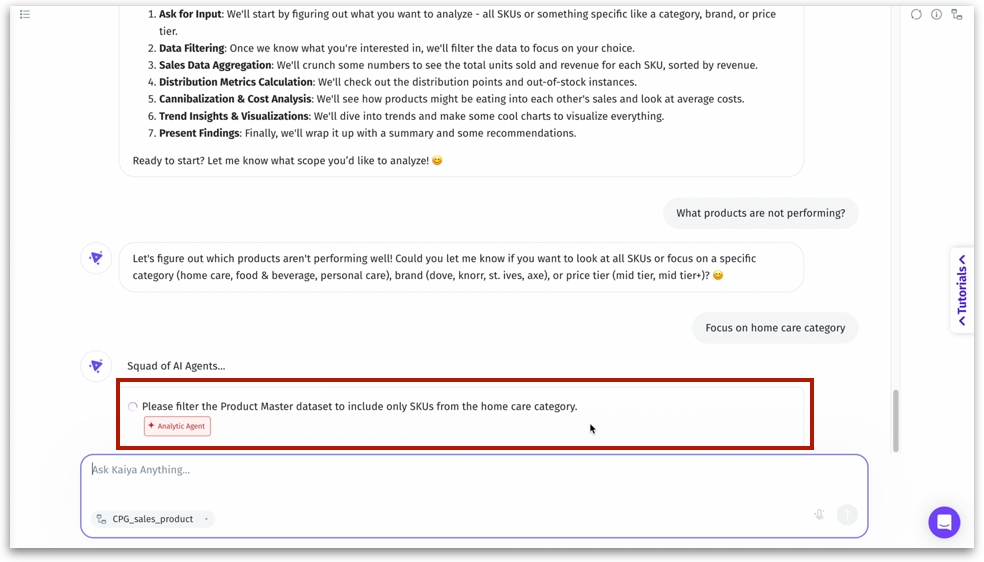
Conditional logic and dependencies between steps are respected. Prompts for additional user input (e.g., filters, time periods, dimensions) may be triggered dynamically. This modular structure enables Kaiya to adapt workflows based on data state, user interaction, or complexity of analysis.
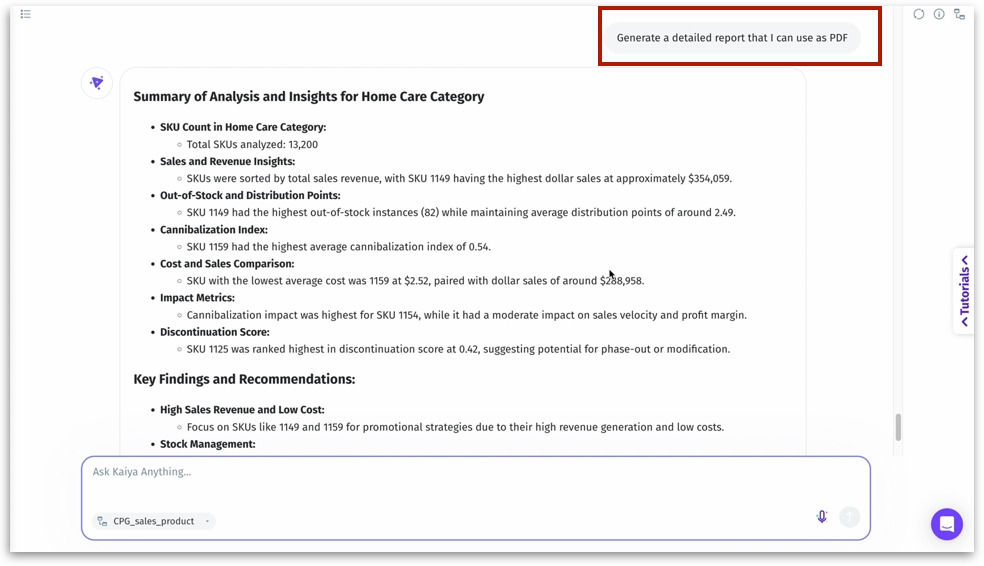
7. Result generation
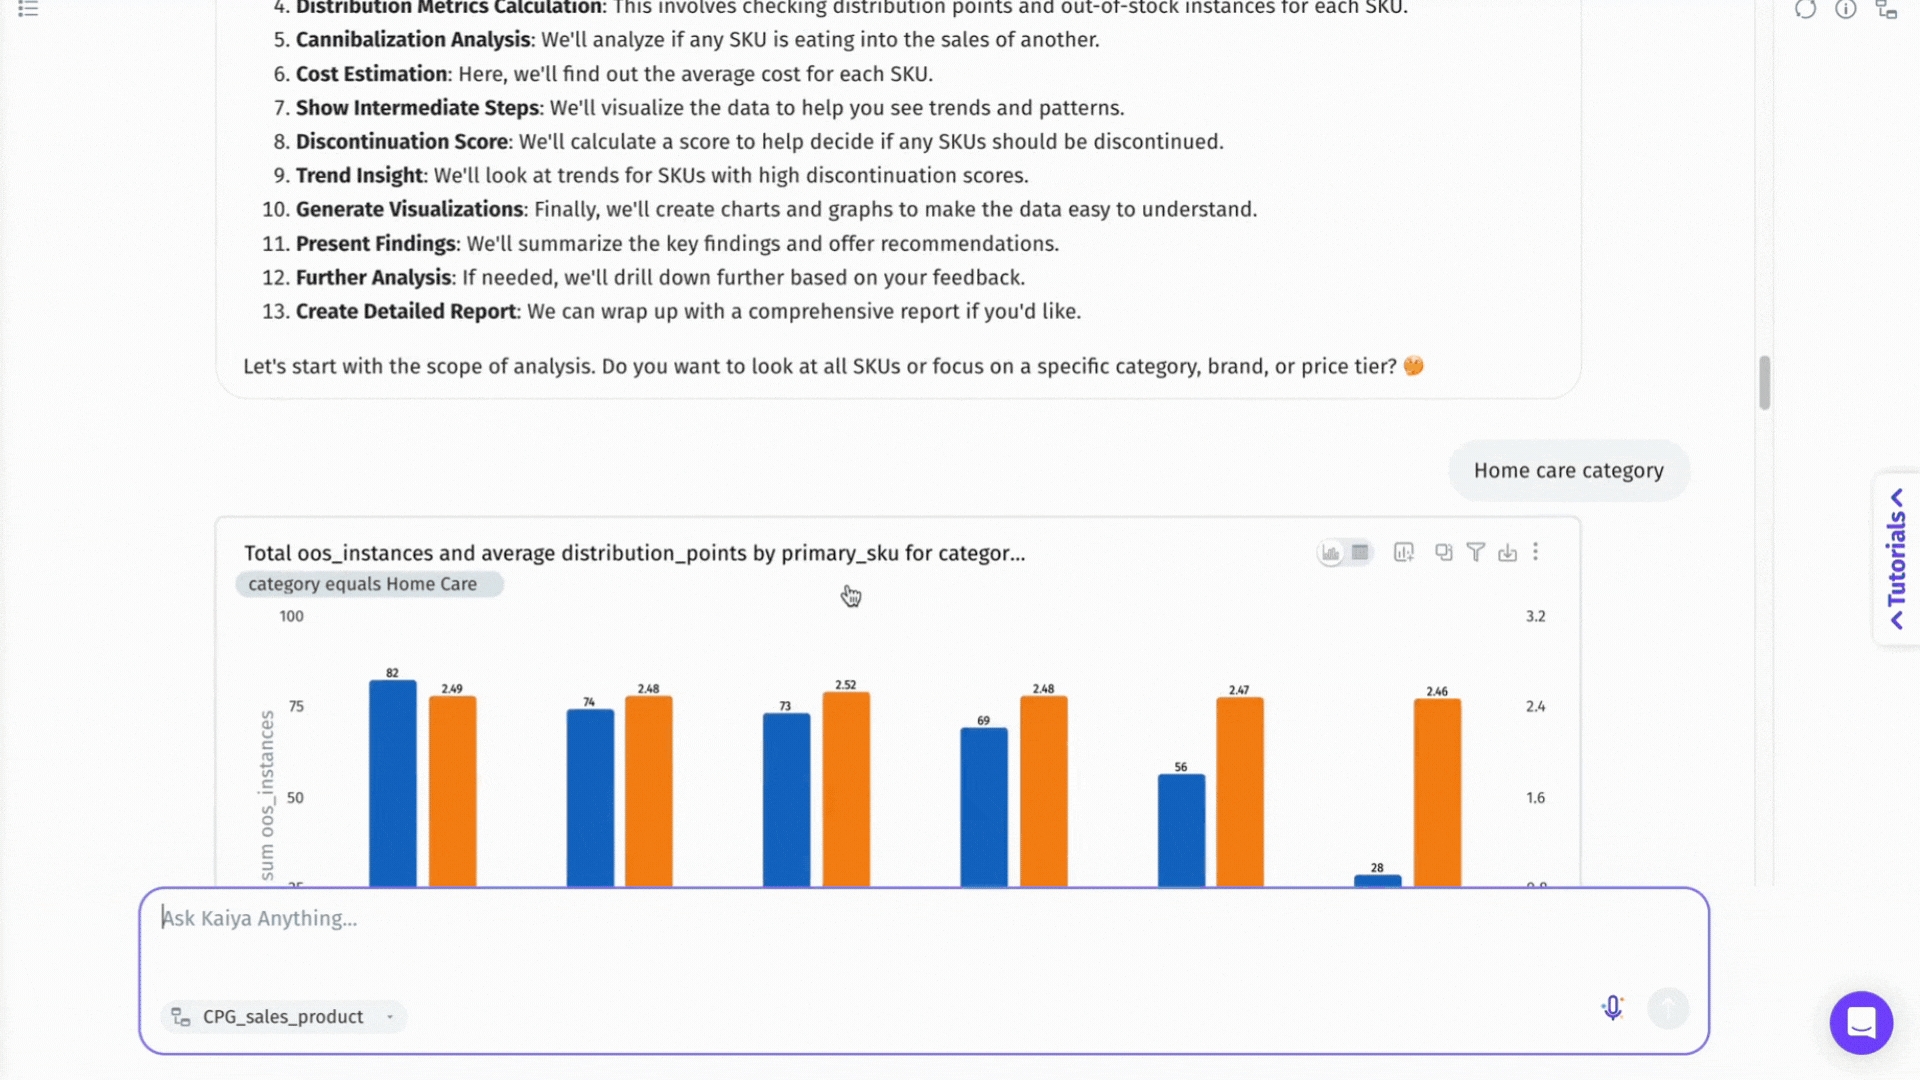
Once the agentic workflow completes execution, visuals, summaries, and insights are presented back to the user. Responses appear conversational but are powered by structured backend analysis.
Charts and graphs (auto-generated)
Tabular data
Root cause explanations
Text summaries with recommendations
Drill-down links or options
8. Post-execution actions
Ask follow-up questions to go deeper
Share results or trigger a different workflow
Request variations or filtered views of the current output
Last updated
Was this helpful?