
Release 4.3 (Fall 2023)
Discover Tellius 4.3: Enhanced data resilience with disk storage, 80% improved search accuracy, and optimized Business View refresh scheduling.
Released in November 2023
The Fall 2023 release is here! 🎉 The latest version 4.3 is packed with the new features you've been waiting for, along with many that will pleasantly surprise you. This time, our focus is on enhancing reasoning, control, and connectivity. The "Understand why" button now gives you an instant peek into the reasons behind each Insight. Our Insight modes let you tailor the speed and depth of your analysis; notably, the first two modes are a whopping 61x faster, reducing computation time by 98%. But that's not all—our integration with Looker Modeler ensures a seamless data connectivity experience. Dive in to know more!
🚀 New features
Bridging the WHY with the WHAT of Insights
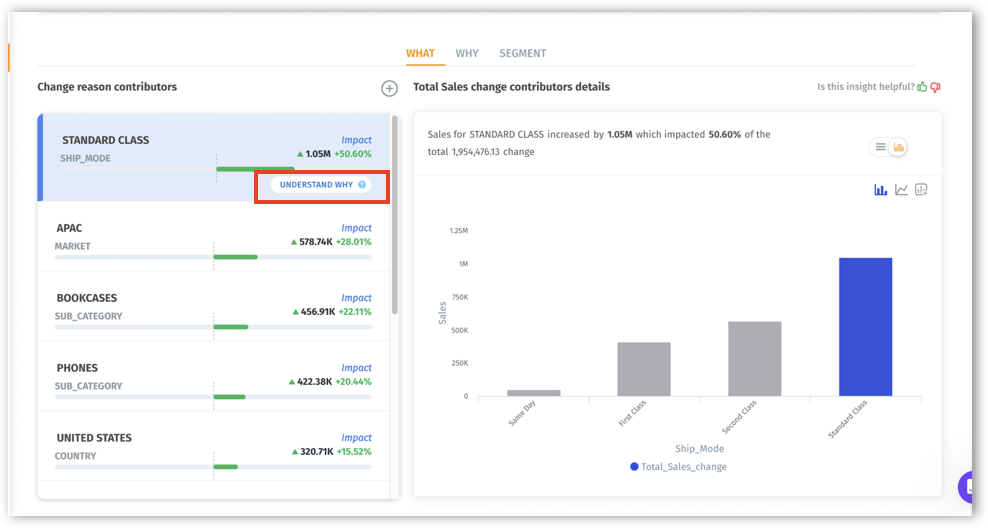
To give users the reasoning behind a result, a new button, “Understand why,” has been included, which will appear when hovered over each contributor. Clicking this button will trigger a tailored analysis, drilling down into specific reasons for that particular contributor's impact. This way, users can get a seamless experience navigating to the "Why” from the “What”, offering an on-demand deep dive into each contributor's data. Users will now have a clear, direct link between the contributors in the "What” section and the reasons in the "Why” section.
The button has the following three states:
Understand Why: Signals a new analysis can be initiated.
Understanding Why: Indicates ongoing analysis with a spinner icon.
Show Why: Appears post successful analysis, directing users to detailed insights focused on the selected contributor. All applied filters will be conveniently displayed at the top, ensuring clarity.
Coupled with an upgraded UI, users can smoothly switch between WHAT, WHY, and SEGMENT tabs and view filters as handy pill tags. Insights journey became more insightful, bridging the gap between viewing results and understanding the “'why”' behind them.
Customizable Insights mode for lightning-fast analysis
With the introduction of three distinctive modes, Insights (Trend and Comparison) can now be customized to your specific needs and time constraints. The mode can be selected while creating a new Insight or editing an existing Insight.
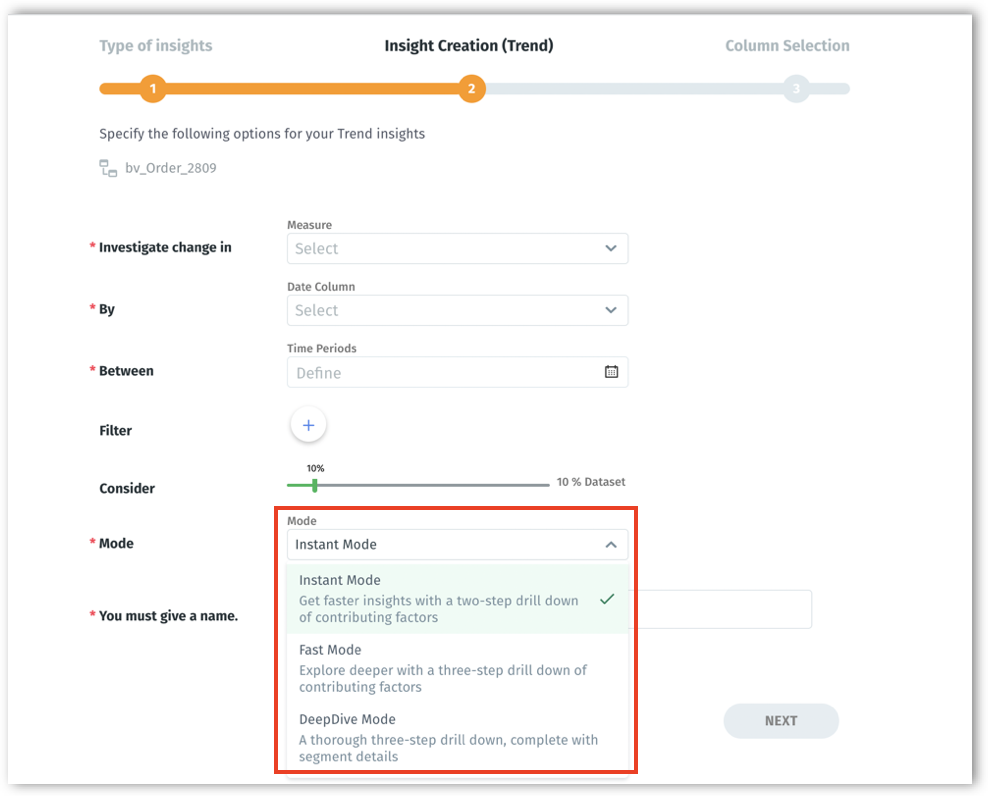
Instant Mode: Ideal for users who need immediate results. Offers a two-step drill-down of contributing factors, providing rapid insights. By excluding segments, the Instant mode delivers results 88 times faster.
Fast Mode: Goes a step further, giving users a deeper three-step drill-down into contributing factors, enabling a more detailed analysis while still maintaining performance.
DeepDive Mode: The full suite of Insight capabilities, including the Segment details.
Insights slashes down 98% of computation time
We've revamped the performance of Insights. This architectural shift has dramatically accelerated data processing and analysis speed. Now, generating trend and comparison insights is faster than ever, with a remarkable 98% reduction in computation time.
Temporal analytics with time period comparisons
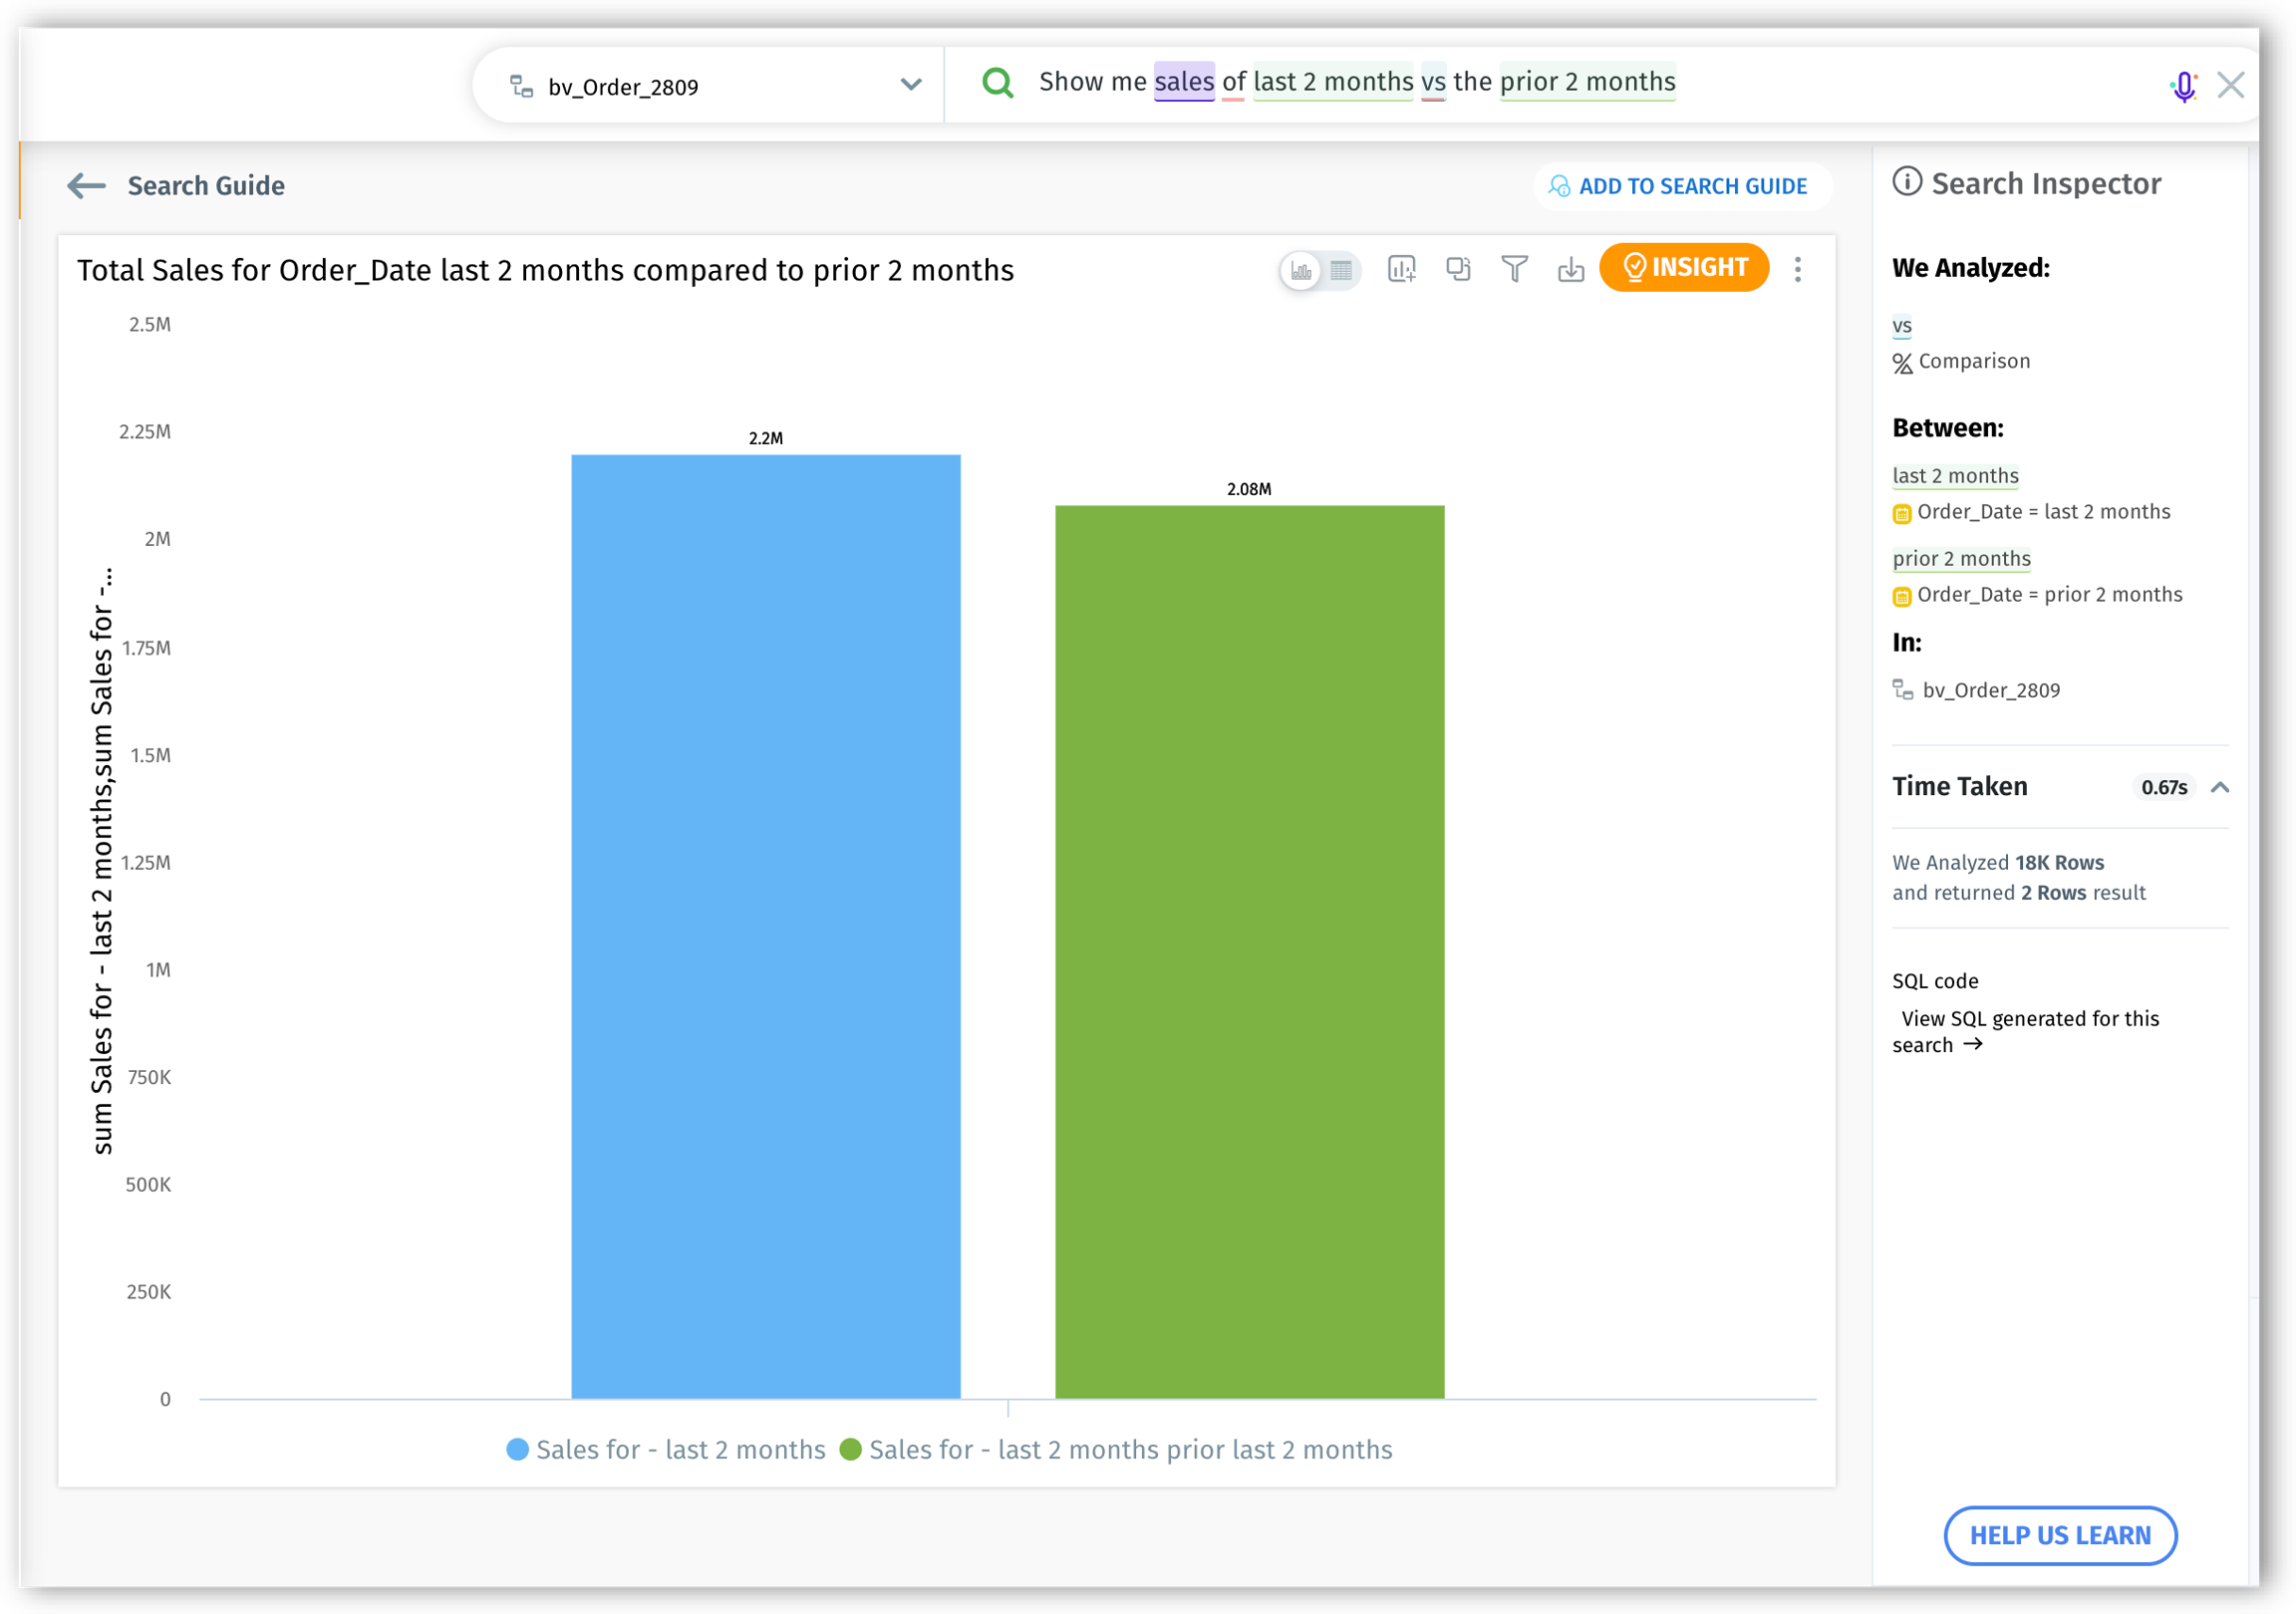
4.3 introduces the following two new out-of-the-box time period comparisons to be implemented directly from search queries. By comparing specific periods against their precedents or the same duration from a previous year, users can make more informed strategic decisions and anticipate trends. The results will be displayed in dual bars for quick side-by-side comparisons.
Time Period vs. Immediate Preceding Time Period: Now, users can compare a chosen period against its immediate predecessor to gain insights on short-term performance, identify emerging trends and monitor current growth against recent historical data.
Example: "Show me sales of last 2 months vs the prior 2 months".
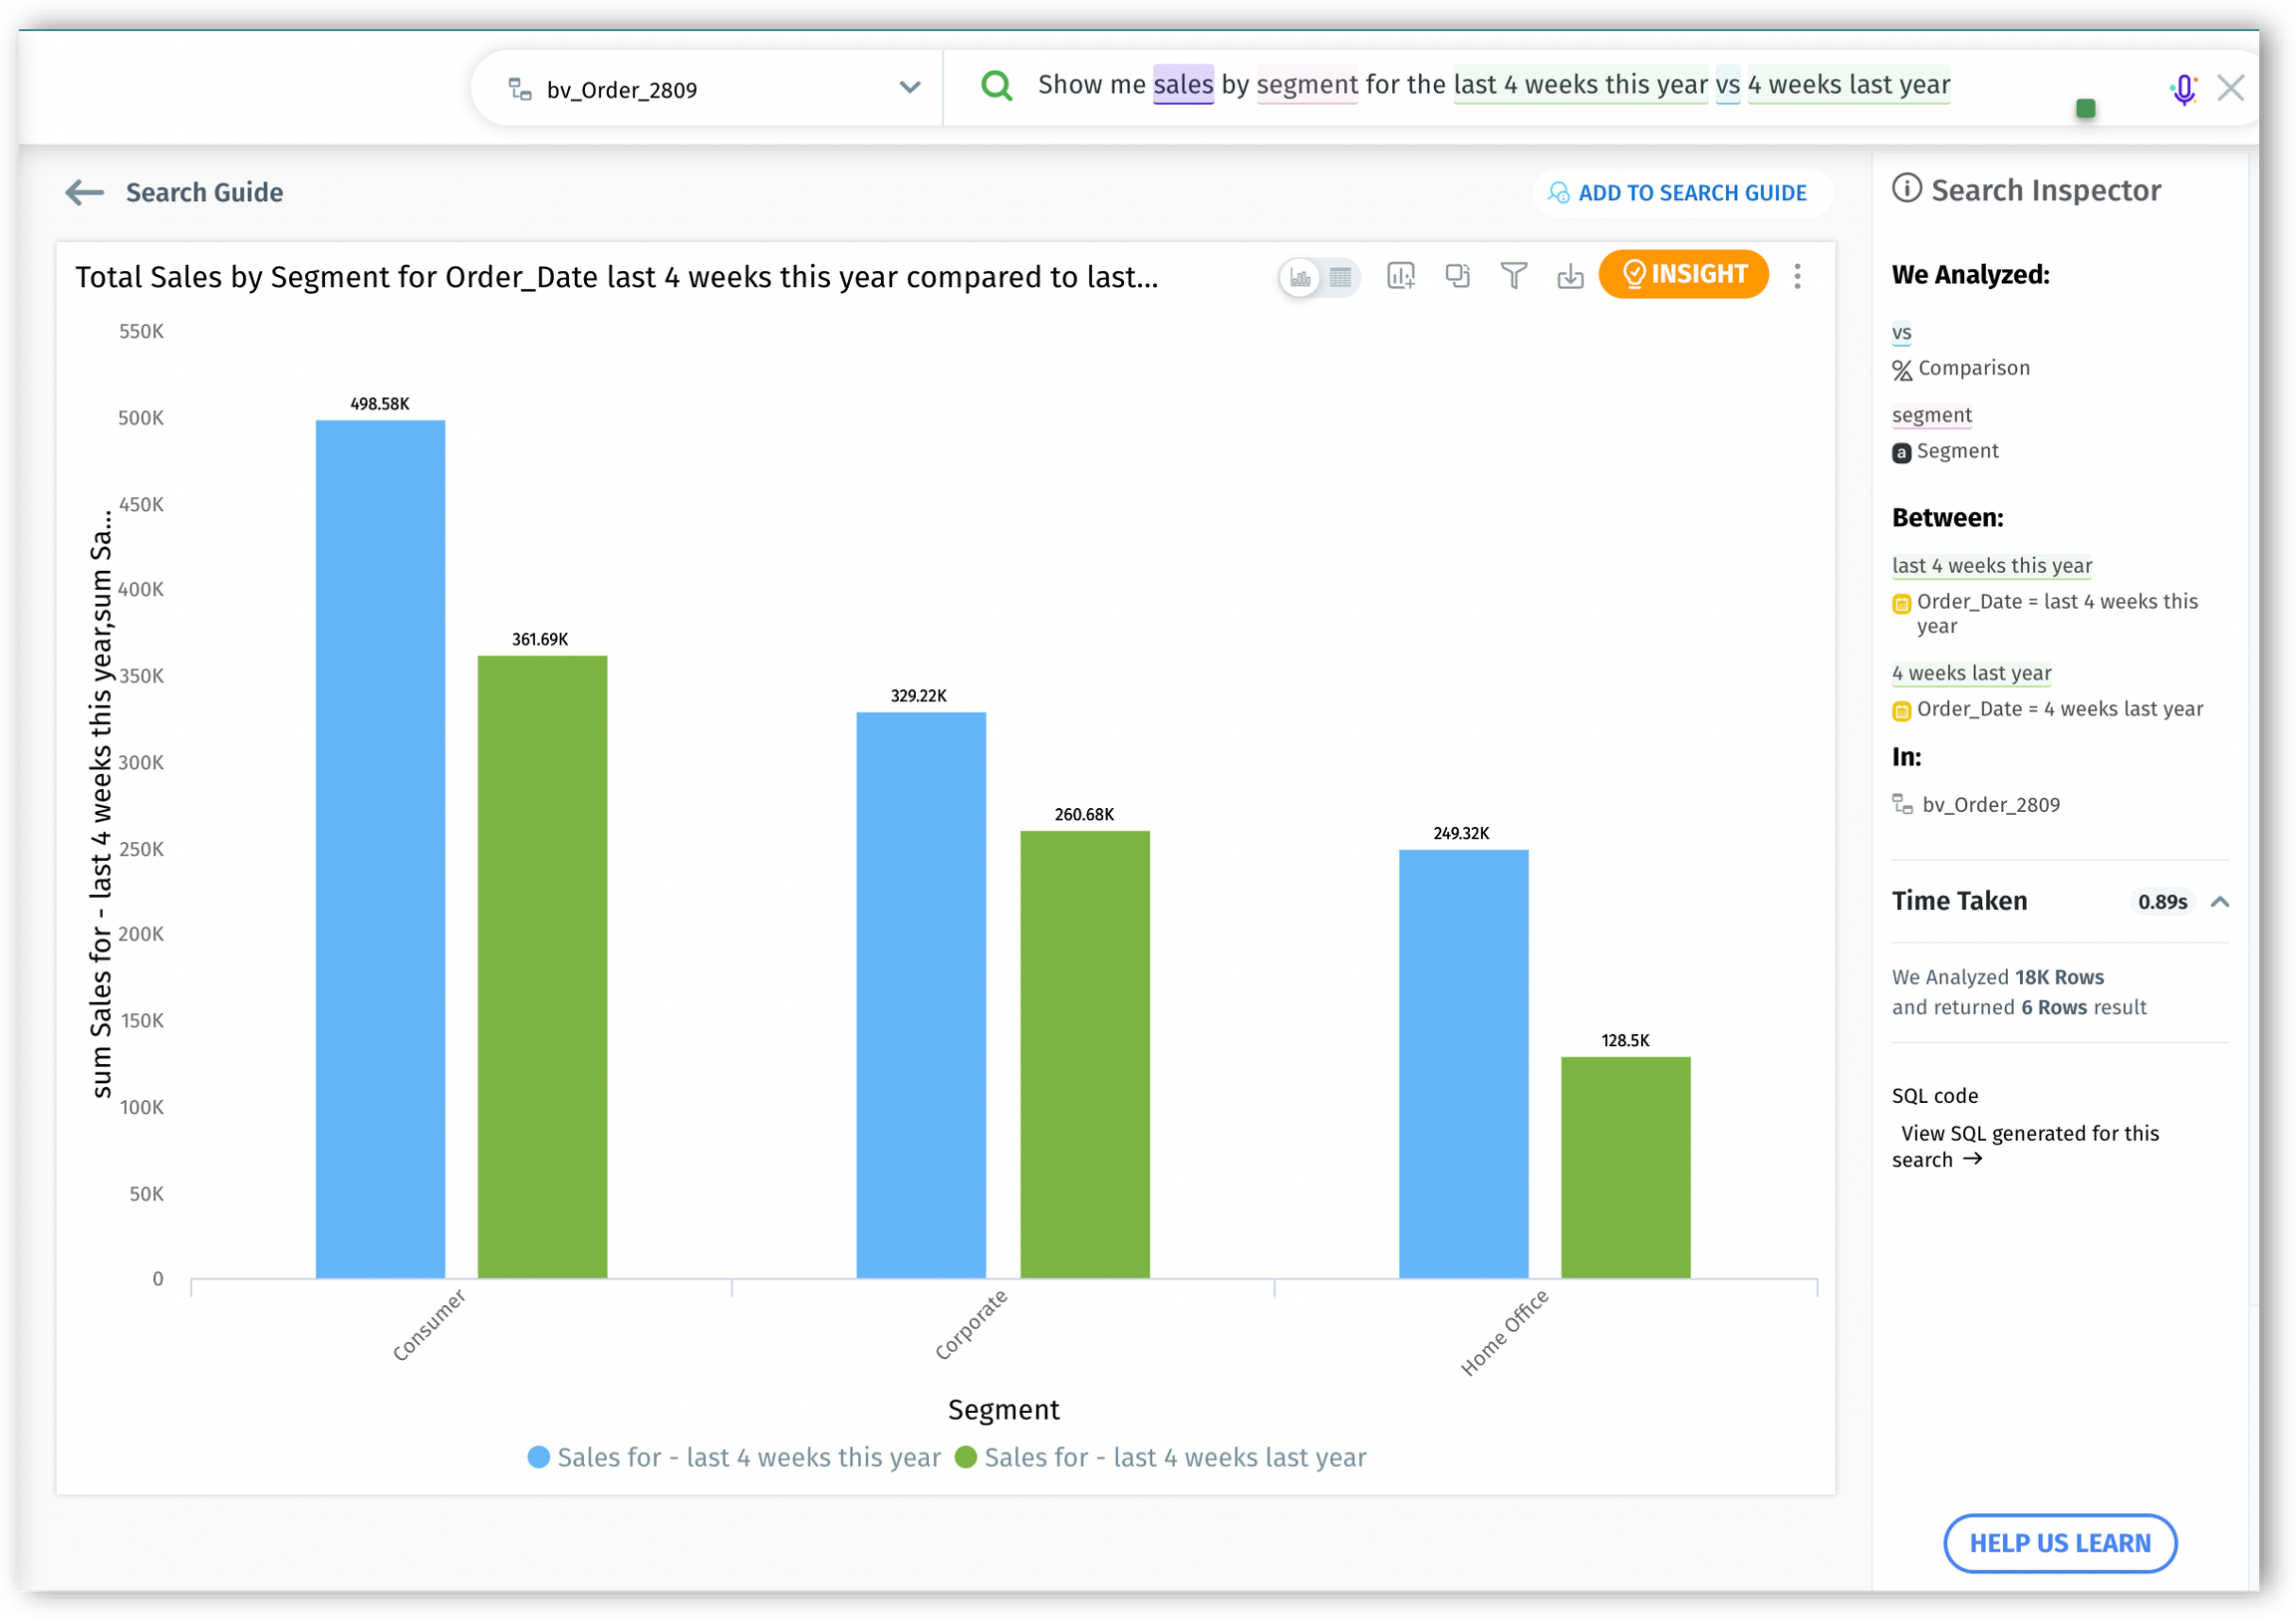
Year-on-Year Time Period Comparison: Assess the performance against the same time period from the previous year to understand seasonal trends, benchmark against the previous year's performance, and measure yearly growth/decline in a more granular manner.
Example: "Show me sales by segment for the last 4 weeks this year vs 4 weeks last year".
From days to quarters, Tellius supports an expansive range of time units to give you the flexibility to extract valuable insights.
Days: "Show me sales by segment for the last 12 days this year vs 12 days last year."
Weeks: "Show me sales of last 7 weeks compared to the prior X weeks".
Months: "Show me sales of last 5 months vs the preceding period”.
Quarter: “Show me sales for the last 3 quarters this year compared to 3 quarters last year.”
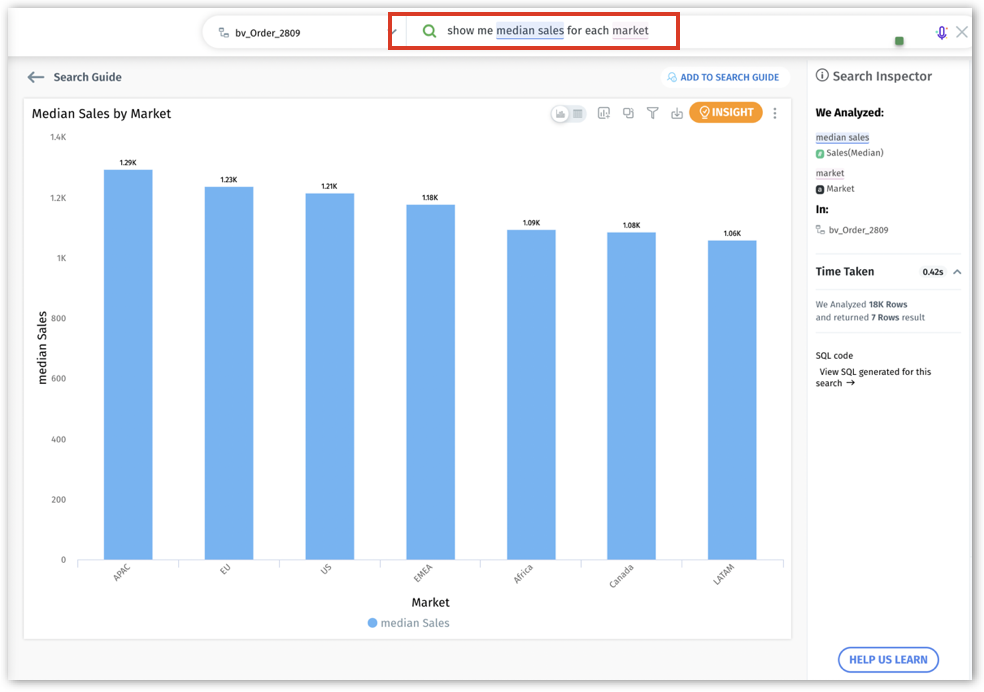
Introducing median aggregation for accurate insights
We’ve introduced median as an aggregation and search keyword, making it a valuable benchmark for your analytics. Median, the middle value in an ordered list, is less sensitive to extreme values or outliers in a dataset compared to the mean. Also, for datasets that are not normally distributed or are skewed, the median can offer a more accurate reflection of the data's central tendency. Users can find median aggregation in the Search, Vizpad, Data preparation tabs across Tellius.
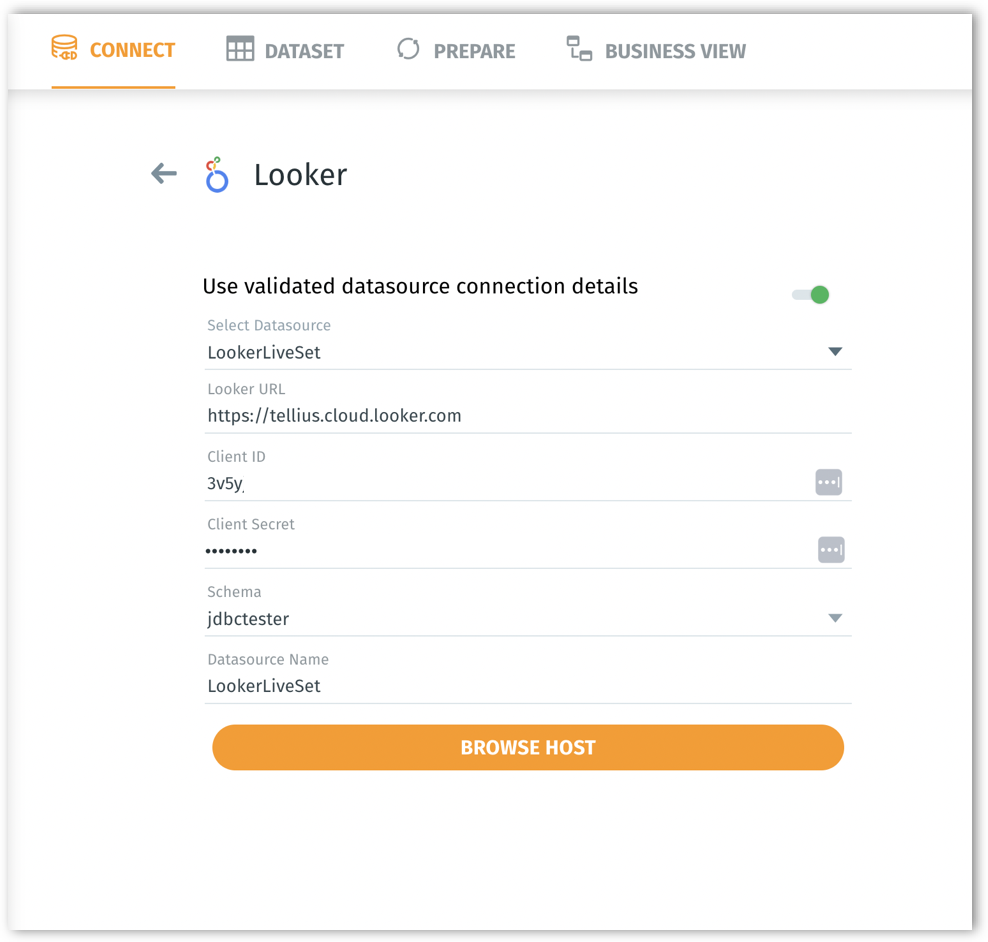
Expanding data connectivity with Looker Modeler integration (beta)
We're excited to announce our integration with Looker Modeler. With this integration, Tellius taps into Looker's robust data modeling capabilities, allowing users to effortlessly sync their Looker data models into Tellius platform via the Looker JDBC Interface. This allows users to:
Seamlessly explore and analyze their Looker data and metadata directly within Tellius, eliminating the juggle between platforms.
Establish real-time live connections to Looker data, bidding goodbye to manual exports or syncs.
Leverage the power of data models from Looker to amplify your analytics in Tellius.
Import data from Looker's denormalized tables smoothly.
Real-time tracking of background tasks
Users can now monitor and manage the status of asynchronous background jobs allowing them to understand the complete progress of their tasks. A new tab “Background Tasks” has been included in the Notifications page, where the background jobs related to Feed creation, indexing, and caching operations of dataset and Business Views can be tracked. Along with the standard details (object name, object type, job type, created at, created by, status, time taken) of a notification, users can also view the details of the parent job under View details.
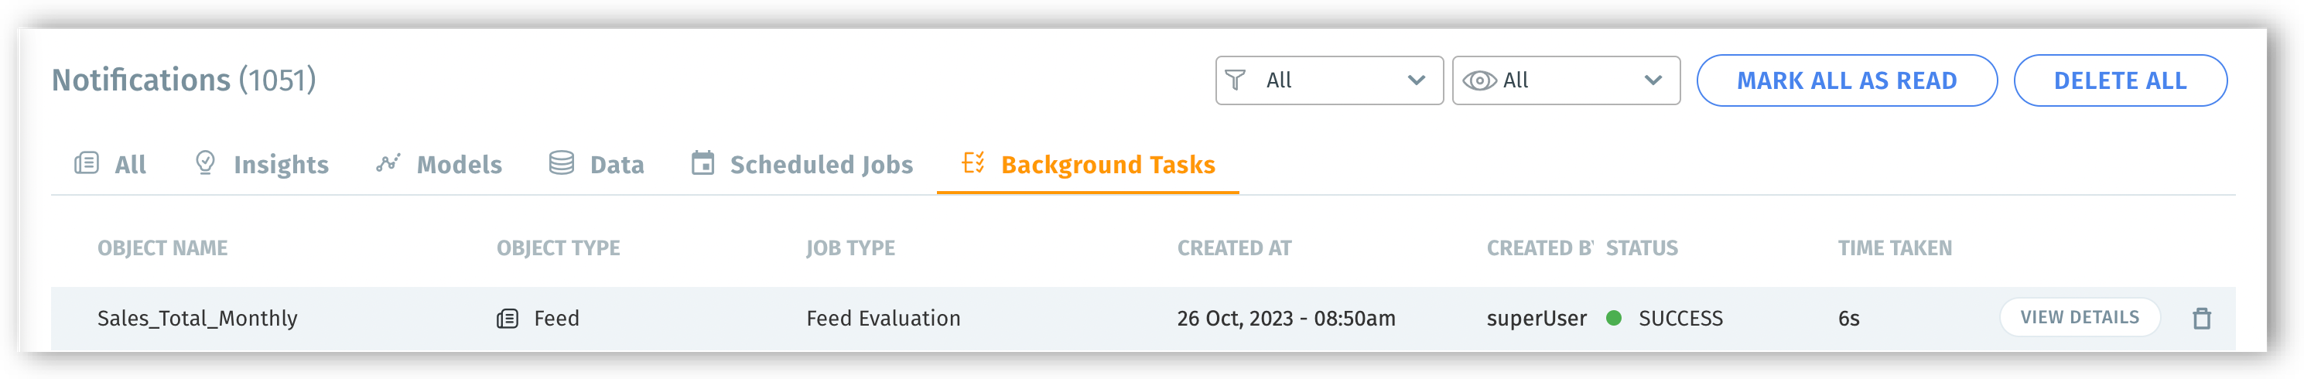
By managing and tracking background jobs, internal teams can swiftly identify, track, and address any job failures, which means faster debugging, quicker resolutions, and reduced downtime.
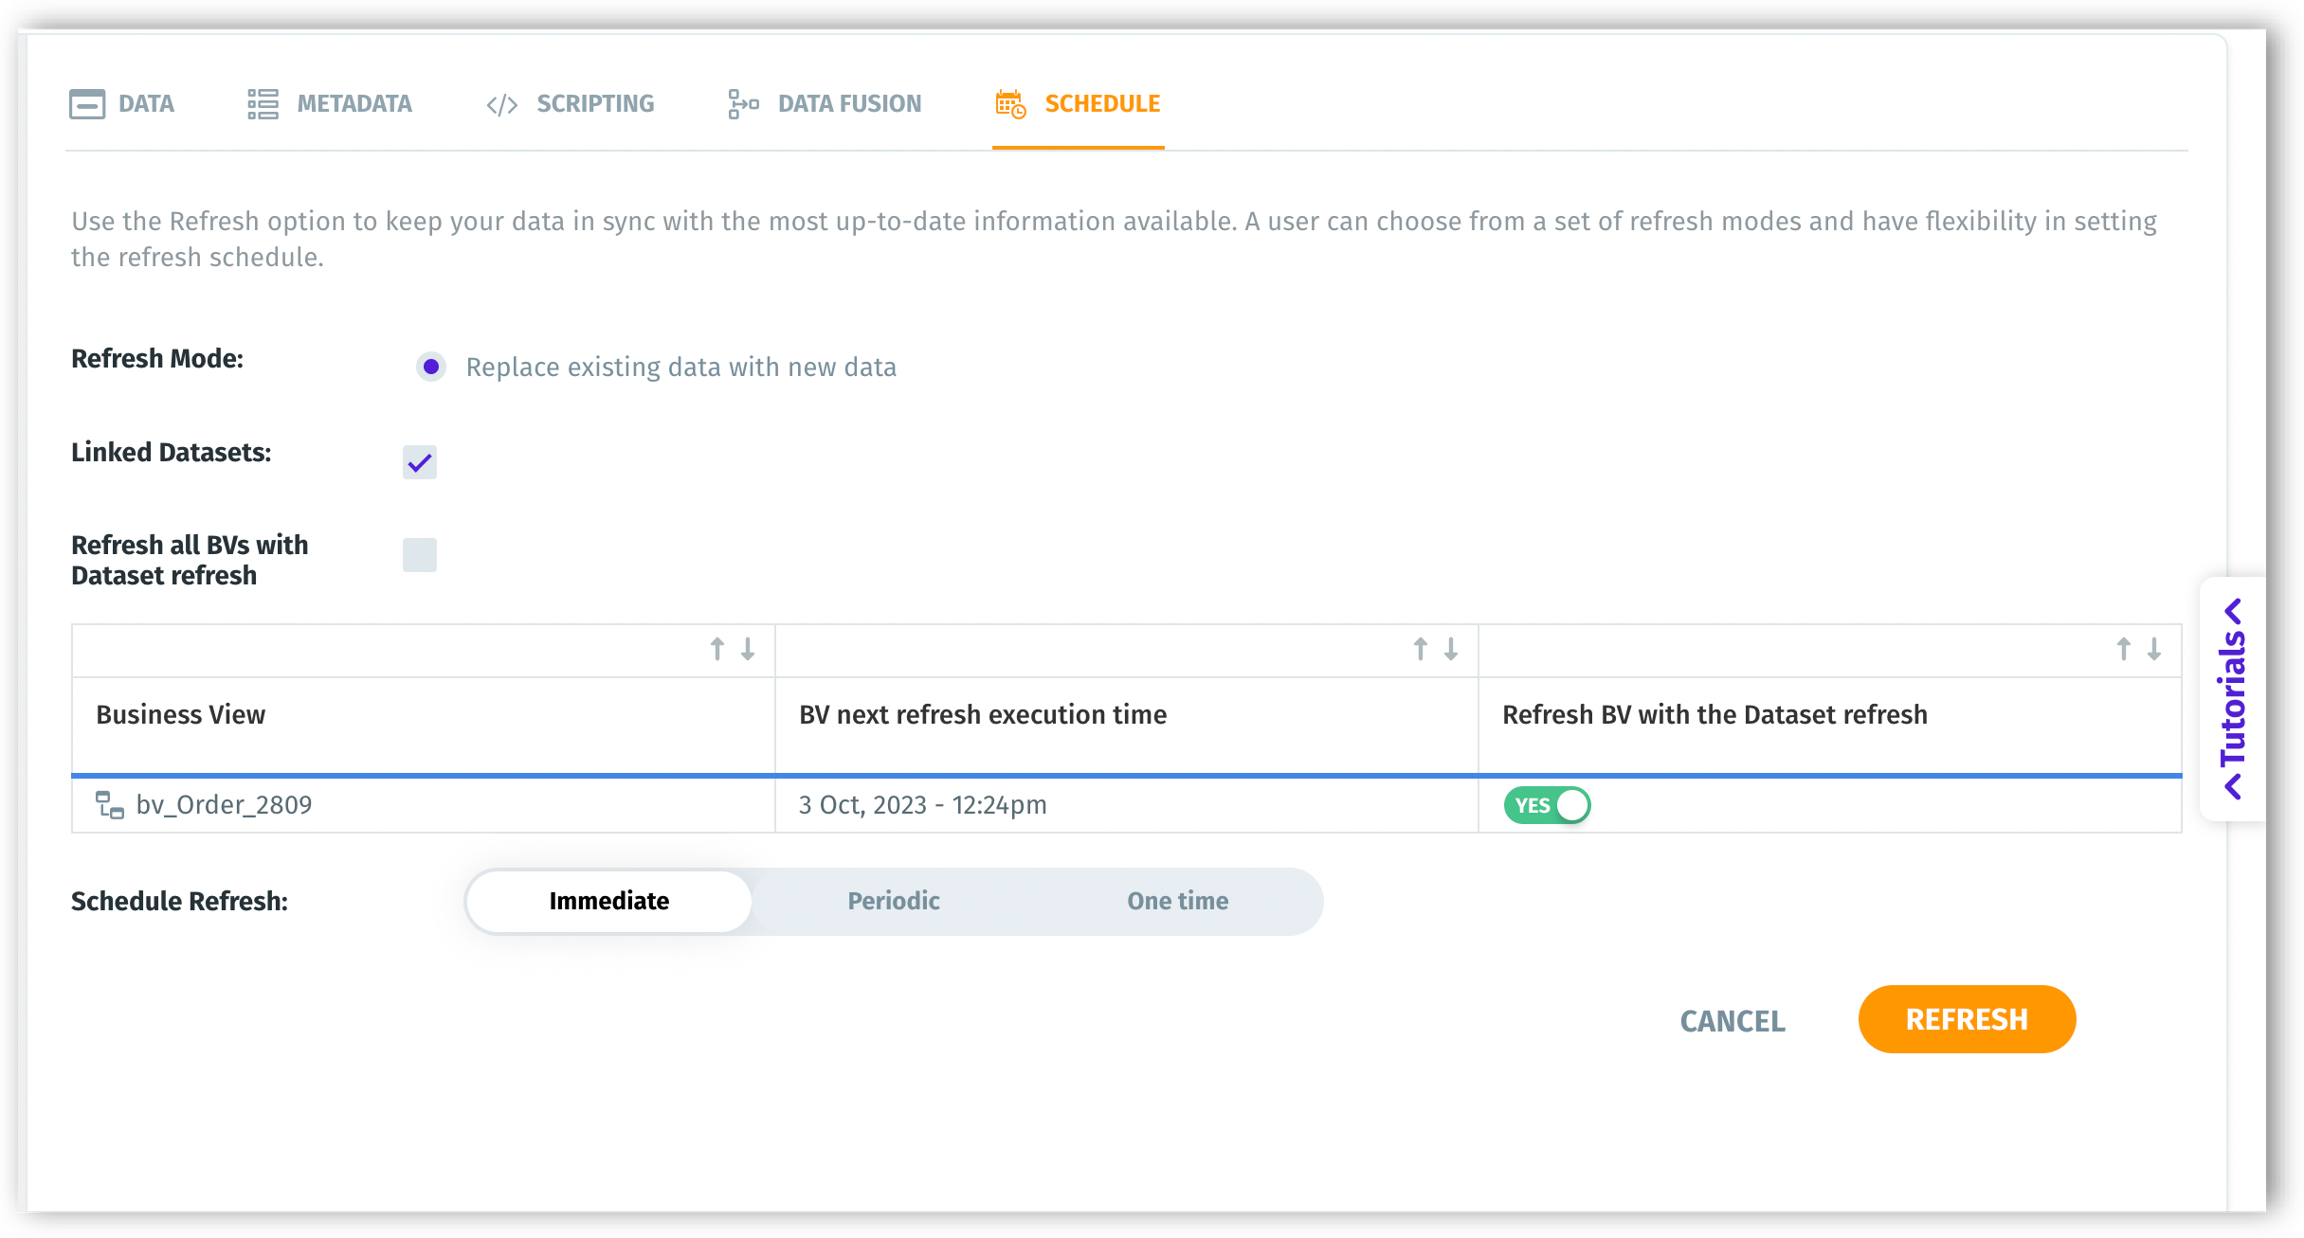
Optimizing refresh of Business Views by customized scheduling
4.3 brings optimization to the performance issues related to Business View refreshes. Admins can selectively schedule the refresh of associated Business Views, after the refresh of the dataset. This significantly reduces wait times, prevents resource congestion from unnecessary dataset refreshes, and ensures faster search results.
Under Prepare and Business Views tabs, admins can schedule and view the frequency and next refresh dates for each dataset. With these upgrades, Tellius provides a seamless, timely, and user-friendly refreshes.
Faster data access with permanent data storage
Instead of only caching your data in memory, we're now saving it directly on the Tellius disk storage. This change means faster access times, reduced data load intervals, decreased overhead, and an overall more resilient platform for you. The data is now saved in stages, from its initial form to its final transformed state, directly on disk. Whenever a dataset or Business View is accessed, it'll be directly read from its saved state on disk, making data retrieval faster and more efficient.
Previously, if a data refresh operation failed due to a broken connection, there wouldn’t be any data left until the issue was resolved. With the new improvement “Atomic Refresh” introduced in 4.3, even if an issue is encountered during a refresh, the older version of the dataset remains accessible and intact. The “Copy to System” option will no longer be present while creating datasets.
This improvement brings in the following changes:
Enhanced resilience: Less risk of data loss or inaccessibility.
Improved performance: Faster access to your datasets and Business Views.
Consistent data: We've resolved discrepancies between disk-stored data and in-memory data for consistent user experience.
Efficiency in refreshes: Even if there's a hiccup during a refresh, users can still access the older copy of the dataset.
📈 Enhancements
Experience 80% more accurate search results
With version 4.3, we've improved the search experience to boost the success rate of your search queries. Our latest enhancements have resulted in an 80% surge in search accuracy compared to our previous versions. Now, every search query you run will yield more relevant and precise results, perfectly attuned to your needs. Get quicker, more accurate results, making your search experience simpler and more efficient.
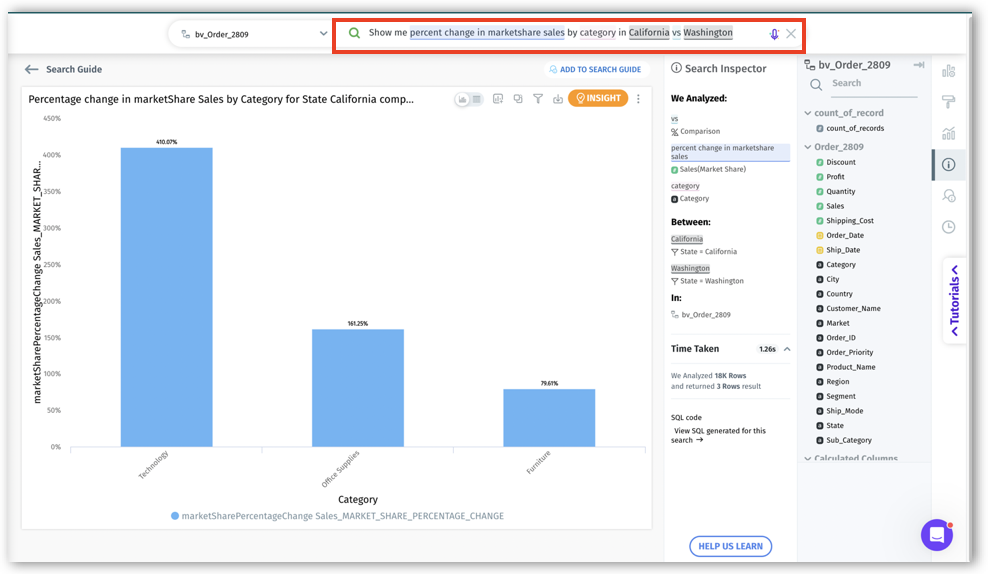
We're excited to introduce the following refinements to our marketshare search queries.
Precisely compare market shares across different time periods or dimensions.
Improved visualization with bar charts for easier comparative analysis.
Additional support has been included for the keyword "percent change" for finding the percentage change in market share analytics.
Users can quickly assess the percentage change in market share without specifying a target filter.
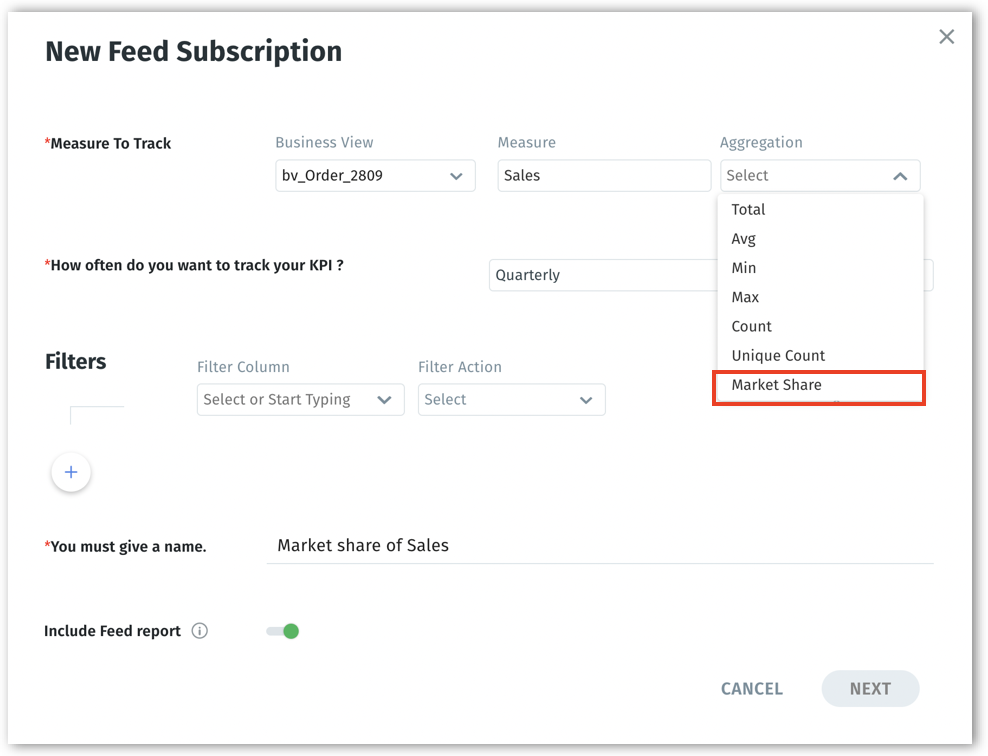
New improvements in Feed
Now, users can track and get notified of anomalies in calculated columns. While creating a new Feed, user-created calculated columns will be available in the list of measures to track, the list of columns during column selection, and the list of filters.
Moreover, users can set market share as an aggregation for the tracked measures during Feed creation.
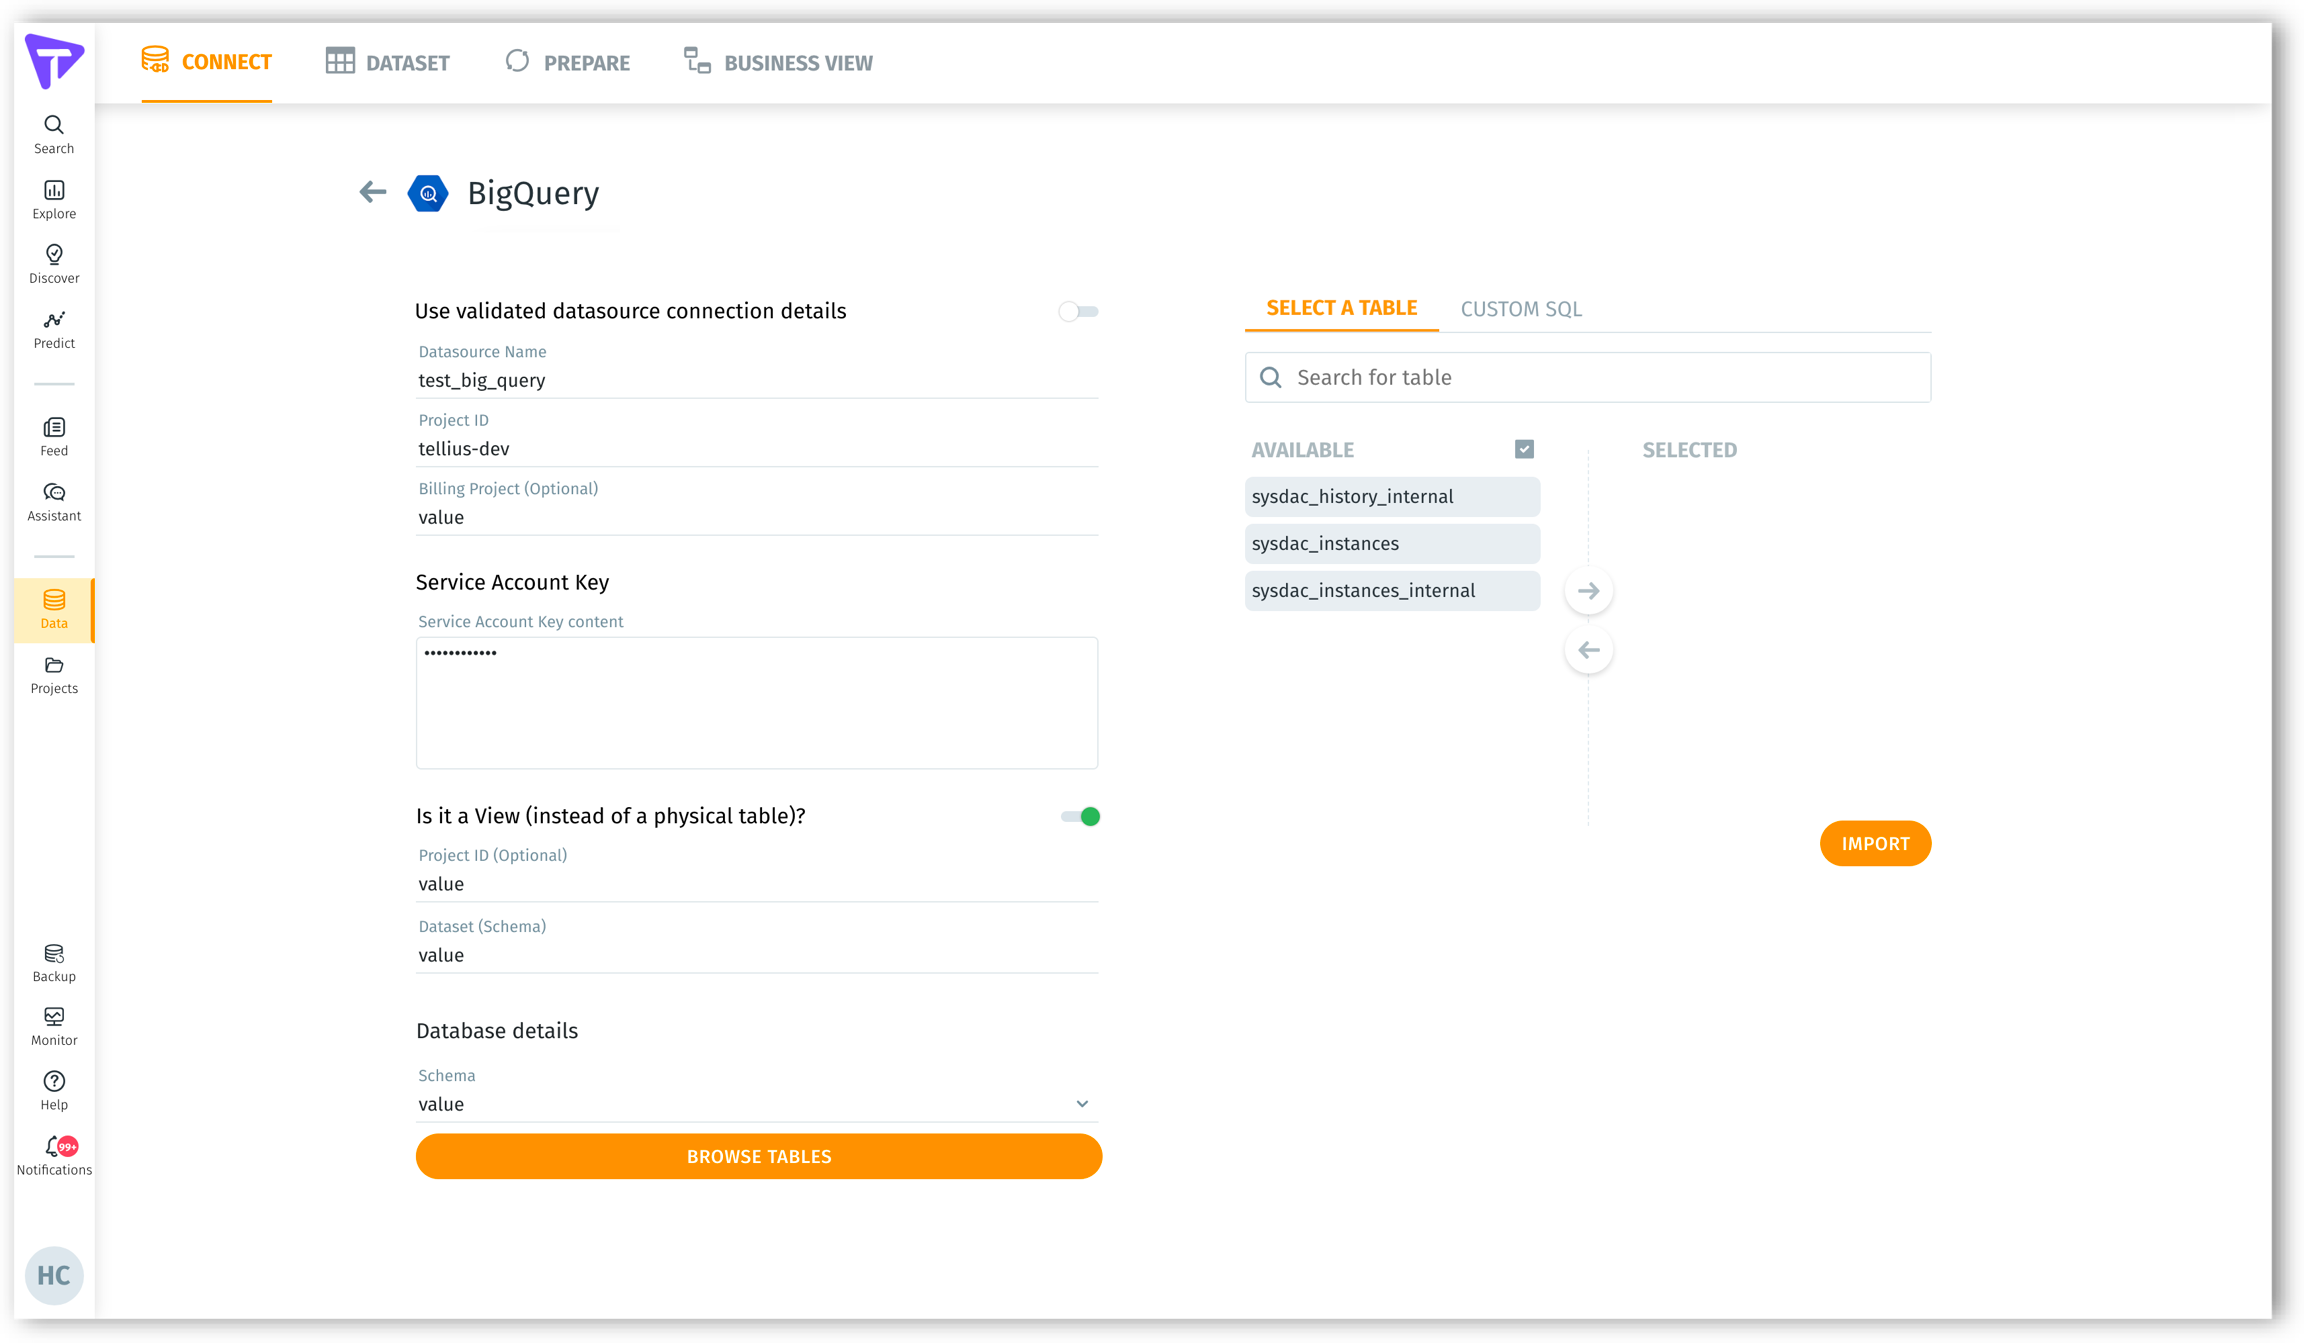
Simplifying data integration with BigQuery
Tellius v4.3 brings key enhancements to Google BigQuery. Now, you don't have to upload JSON keys multiple times for datasets from the same Google service account. This makes things easier for teams that don't usually handle JSON keys and also cuts down on security risks from circulating these keys around.
We've also added a feature that lets you choose a different billing project for each task--allowing you to distribute costs more effectively across various projects.
SQL query capability has been included for users to write custom SQL queries and also load external tables.
Additionally, Tellius now offers live connections to BigQuery. This update provides you with faster and more direct access to your data, improving your ability to make quick, informed decisions.
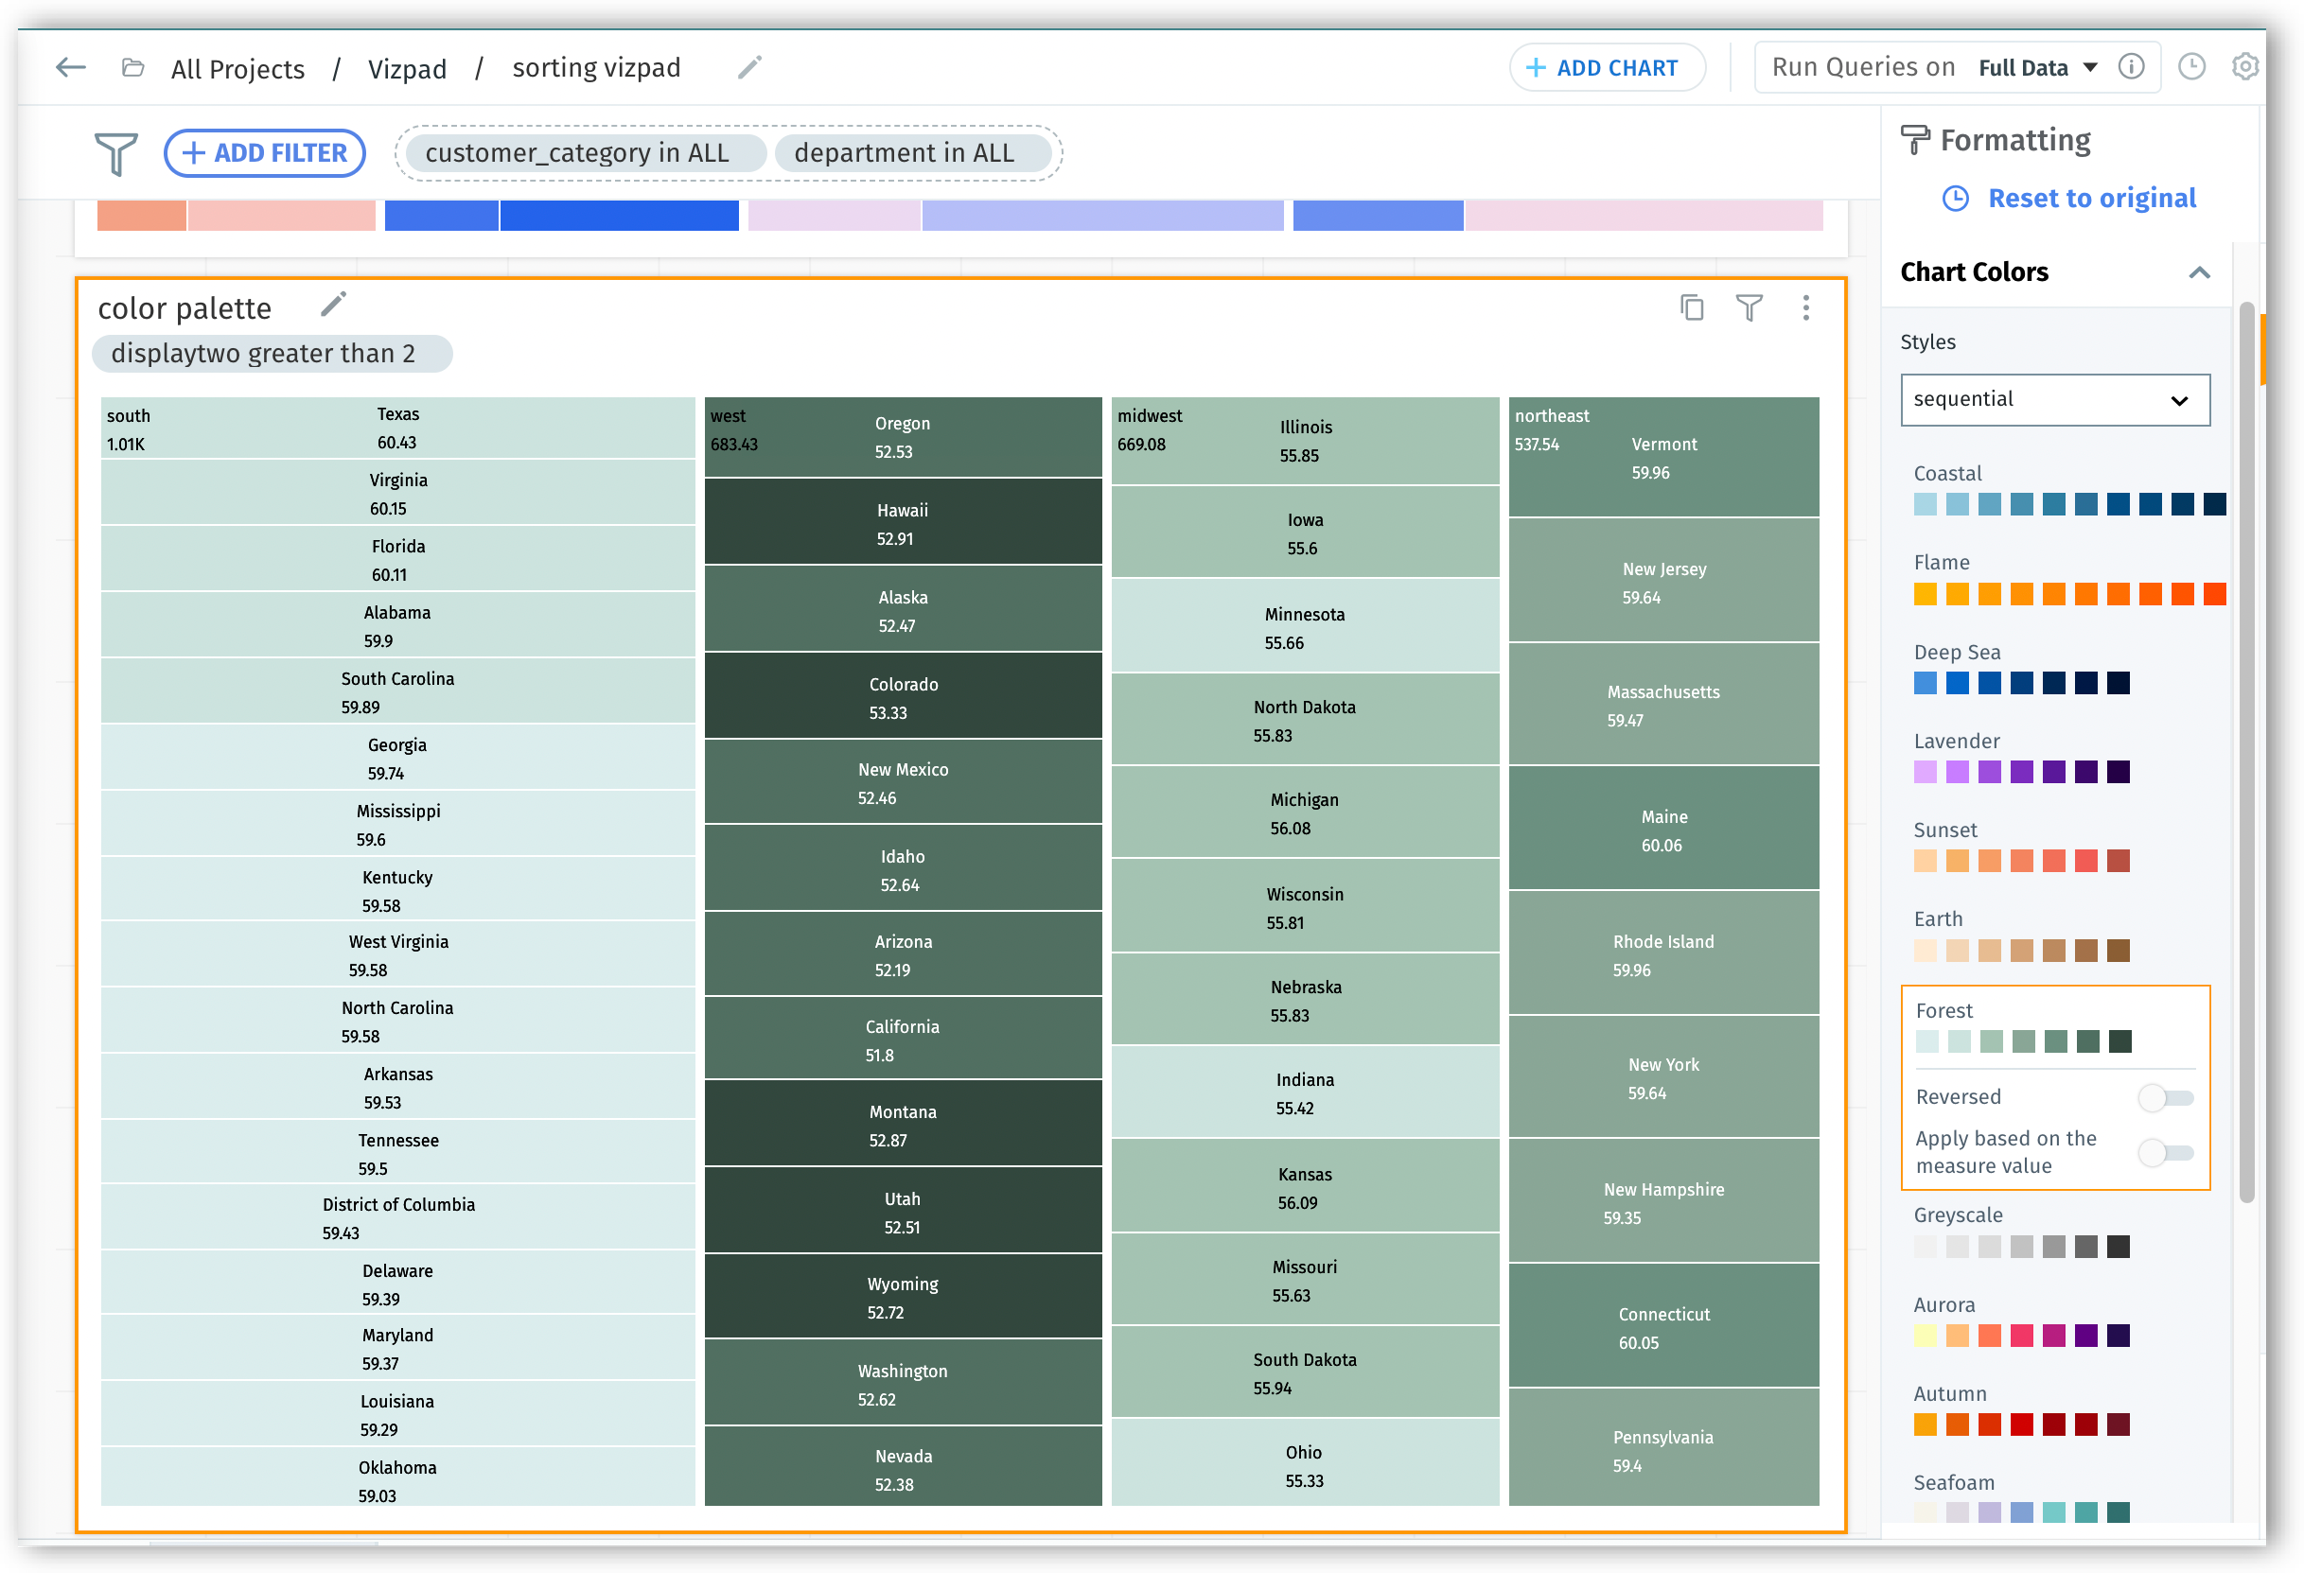
Intuitive color palette logic in Vizpads and Search
The latest release improves how colors are assigned from palettes in Vizpads and Search, making them more intuitive and user-friendly.
For heatmaps, treemaps, boundary maps, and location maps, users now have more flexibility in choosing color palettes. Under Formatting, users can select from predefined color divergence options, allowing them to reverse the selected colors or apply different shades to the selected color range.
For treemaps without a measure or dimension in the color field:
Parent nodes will feature divergent colors for clearer visual distinction.
Child nodes are optimized to remain visible despite significant value differences.
Negative values are now appropriately represented.
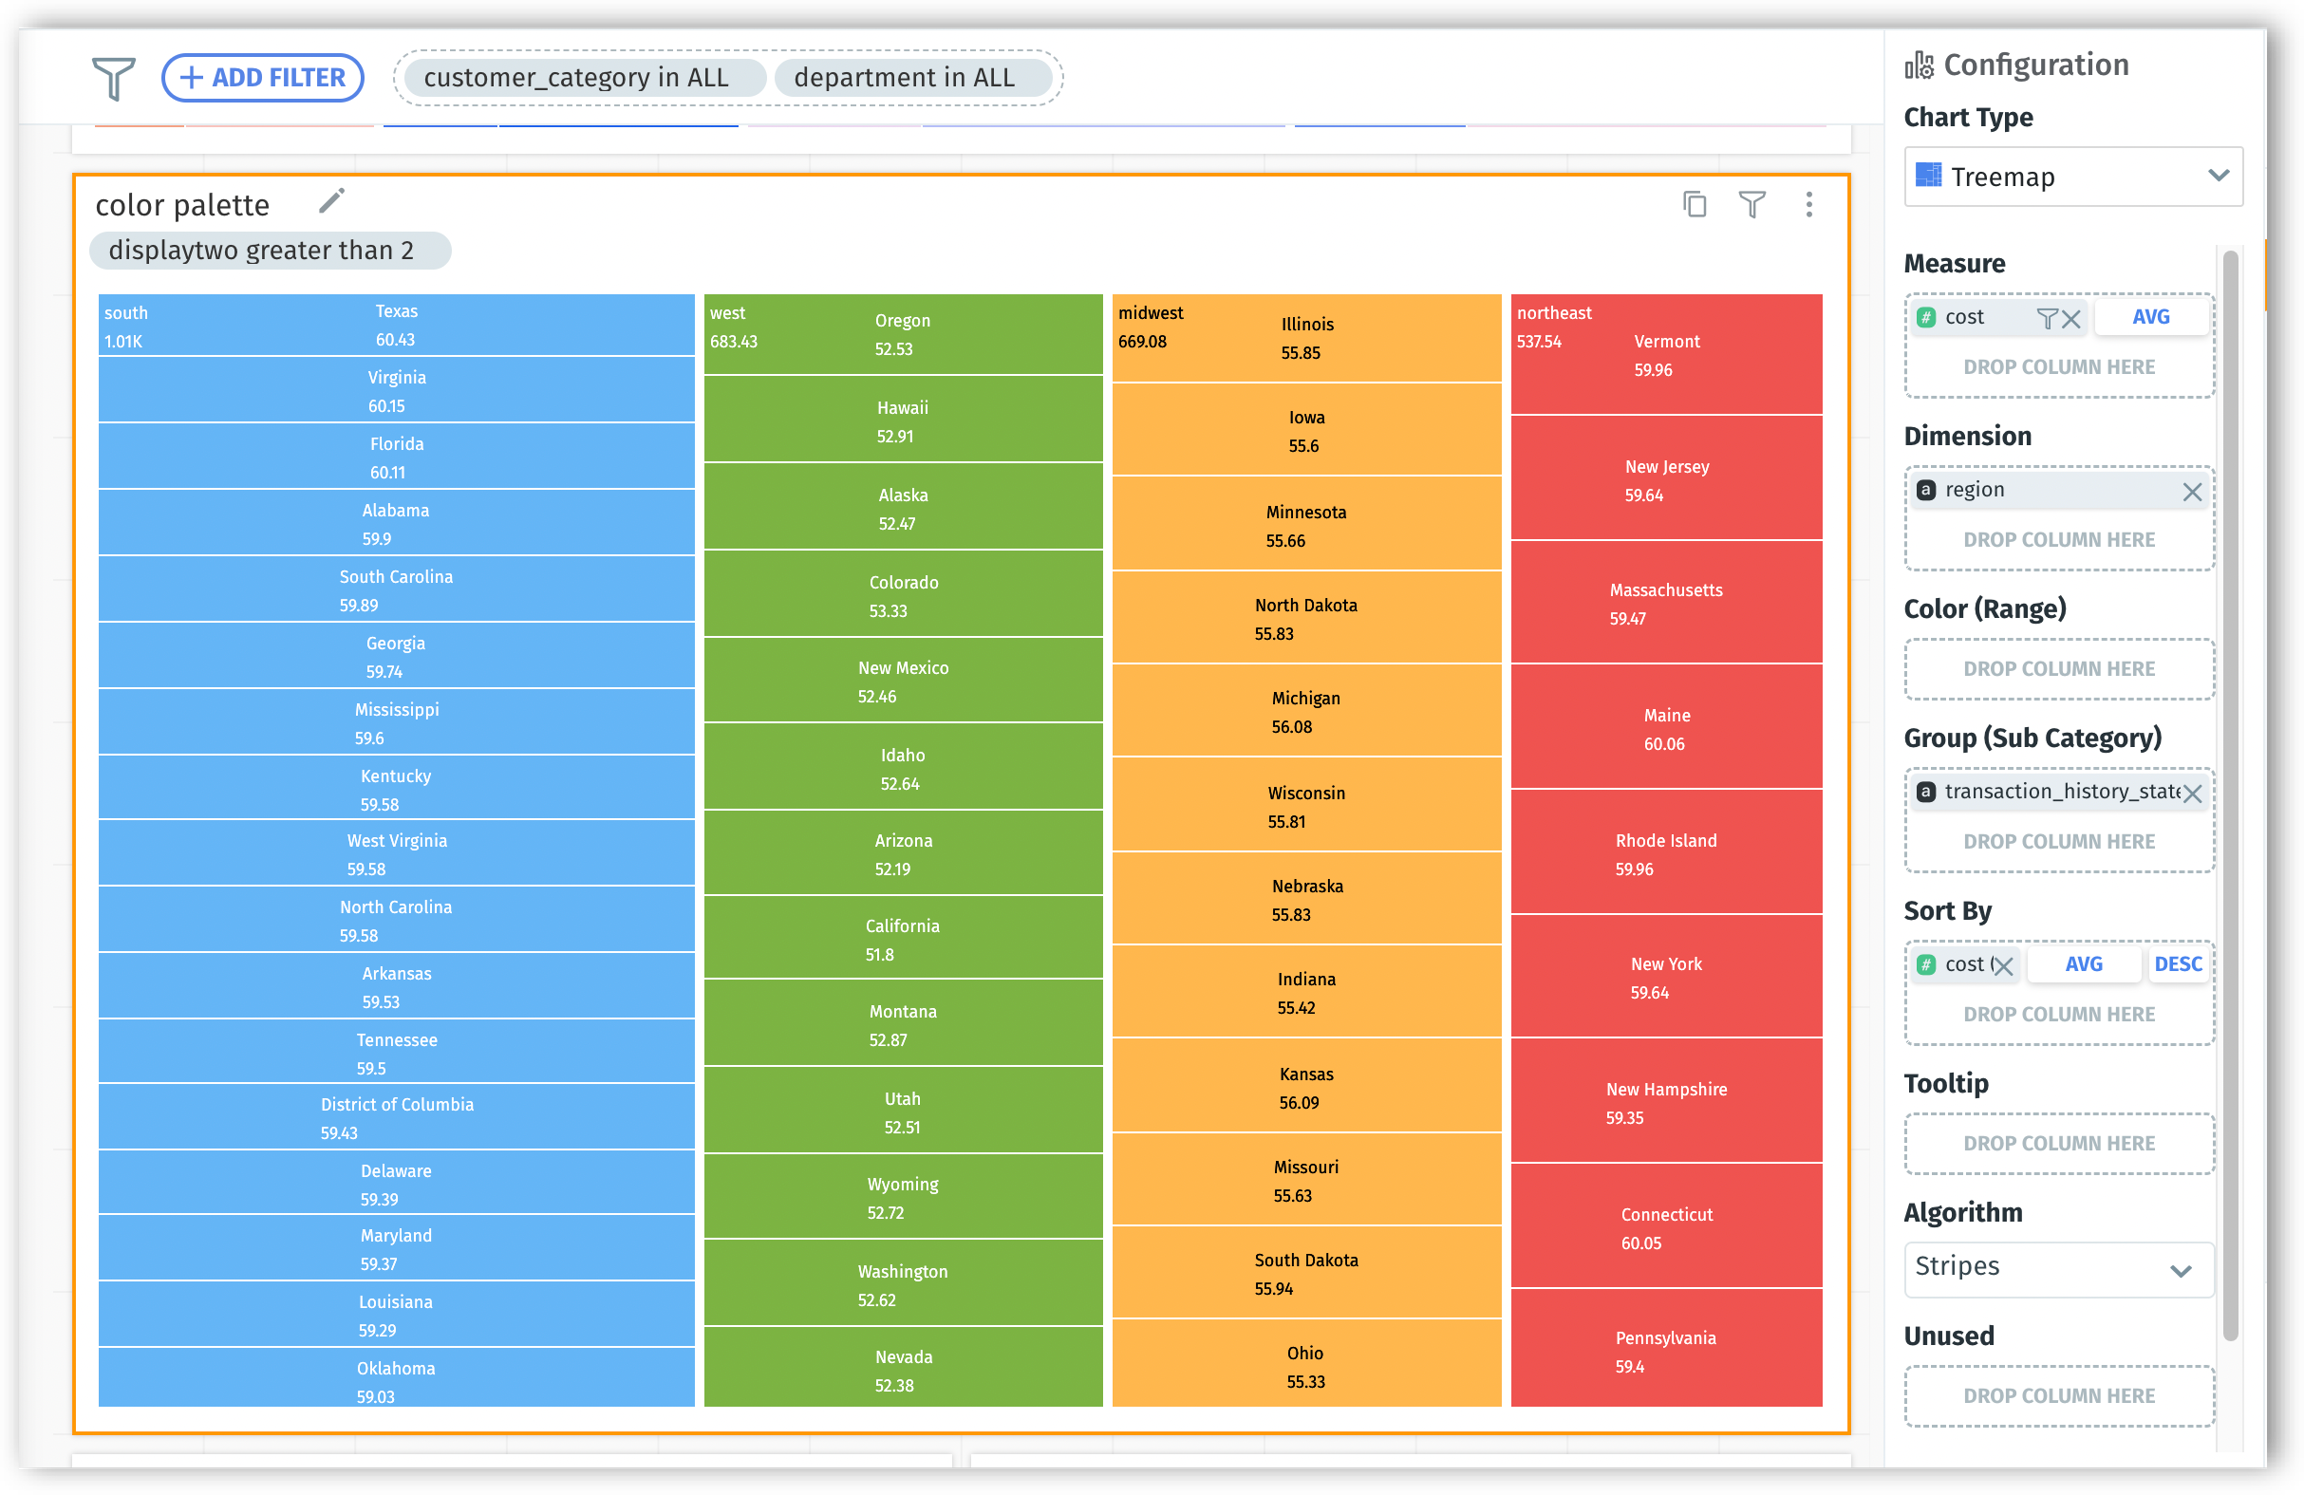
For treemaps with a measure or dimension in the color field:
Users can customize color ranges for multiple measures and dimensions and experience layered differentiation. For instance, if a chart represents revenue by year and further breaks down by state, adding another group (e.g., gender) would further segment each line for a clear state-gender combination representation.
Users will receive a warning when there are more unique values than available colors in a palette, ensuring clarity around repeated or missing colors.
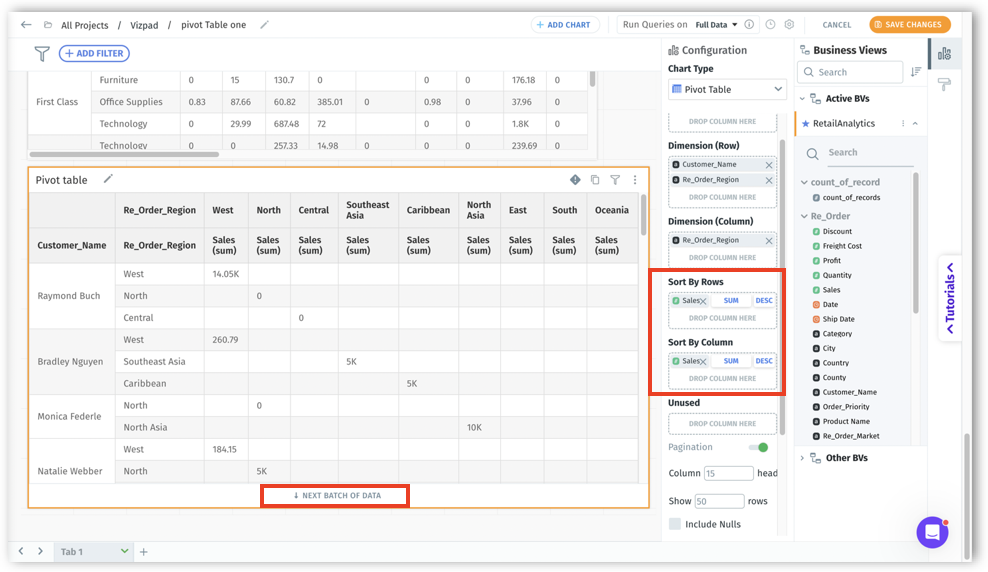
Sorting enhancements to Vizpad charts
4.3 brings sorting improvements for pivot tables, stacked bar charts, and tree maps. These advancements provide users with a clearer, more customizable visualization experience.
Pivot Table:
Excel-experienced business users can now enjoy dual-sort capabilities for rows and columns, offering a familiar user experience.
Sort your rows and columns based on dimensions or total measure values.
The results for high-cardinality columns will be displayed in batches of data.
View error prompts when data point limits (20,500 data points) are exceeded, ensuring optimal chart creation.
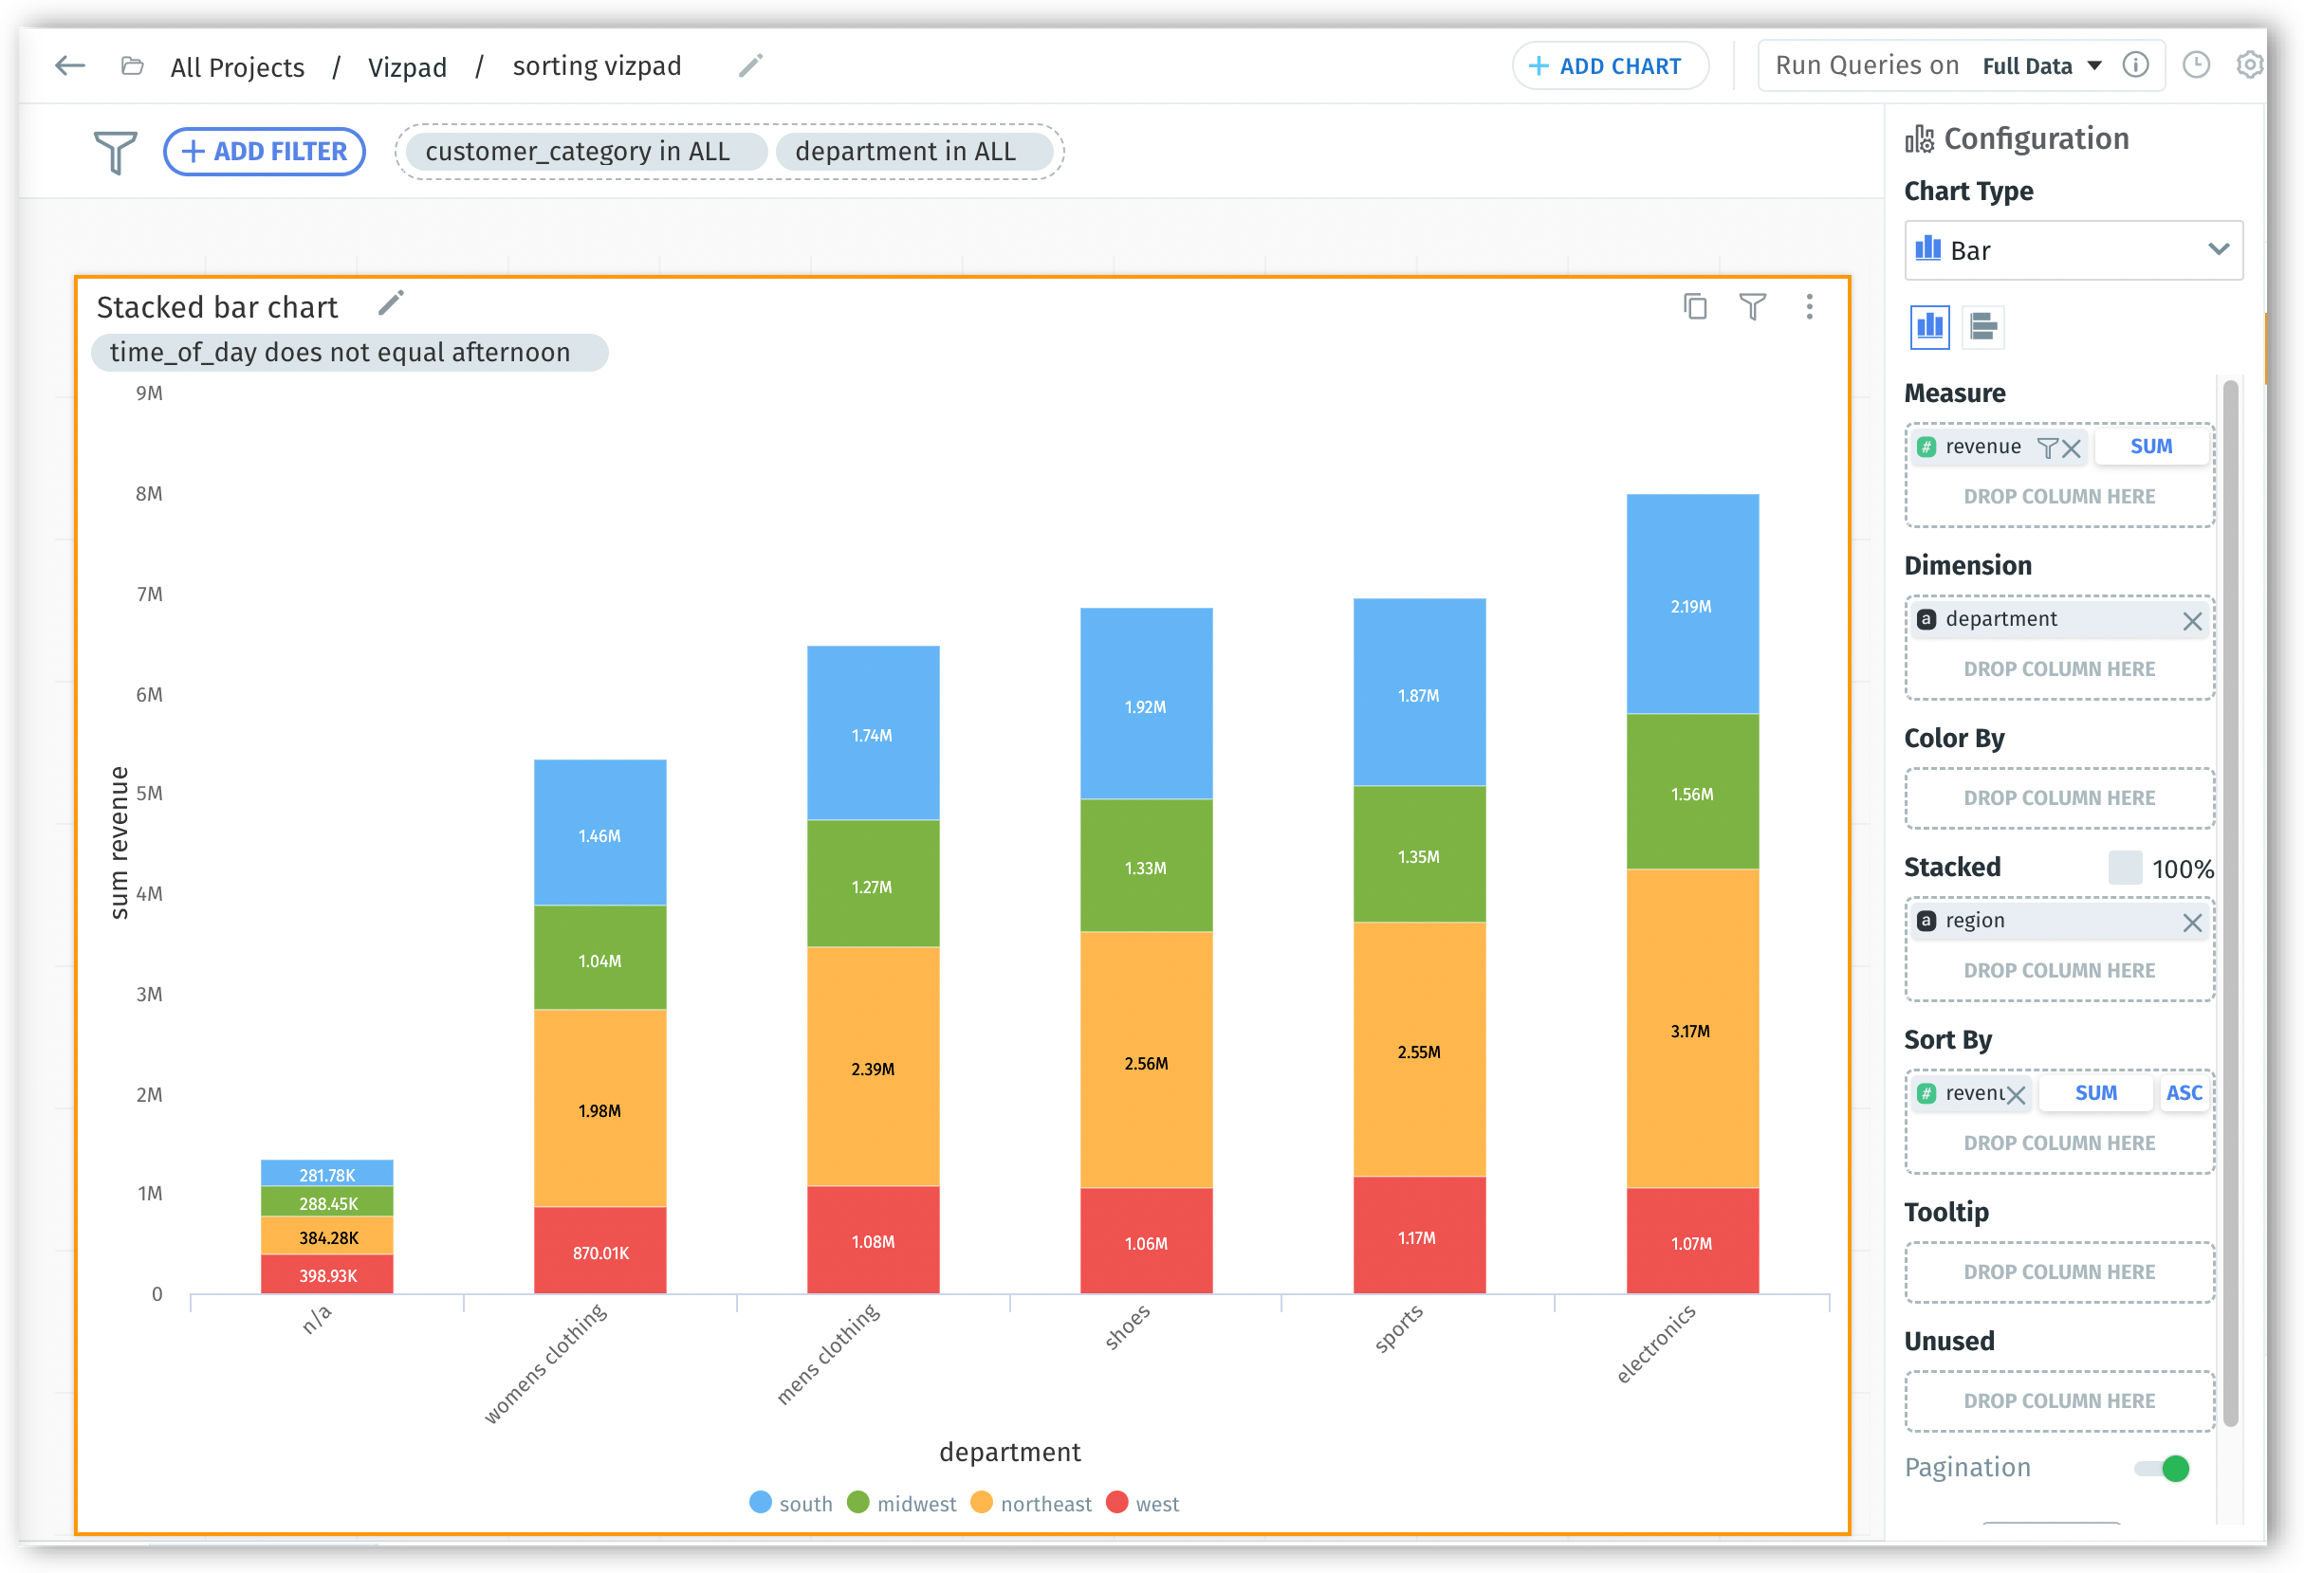
Stacked Bar Chart:
We've upgraded our bar chart display with dual-level sorting capabilities. Now, each stacked bar chart follows the user-defined sorting. Within individual bars, segments are precisely stacked according to the preferred sorting method—ascending or descending.
First-level sorting: The bars will be primarily sorted based on the total of Y-axis values. For dates, enjoy a default ascending order, and for dimensions, a descending order based on Y-axis total.
Second-level sorting: Within each X-axis value, experience refined sorting for grouped segments based on Y-axis values, respecting user-defined sort order.
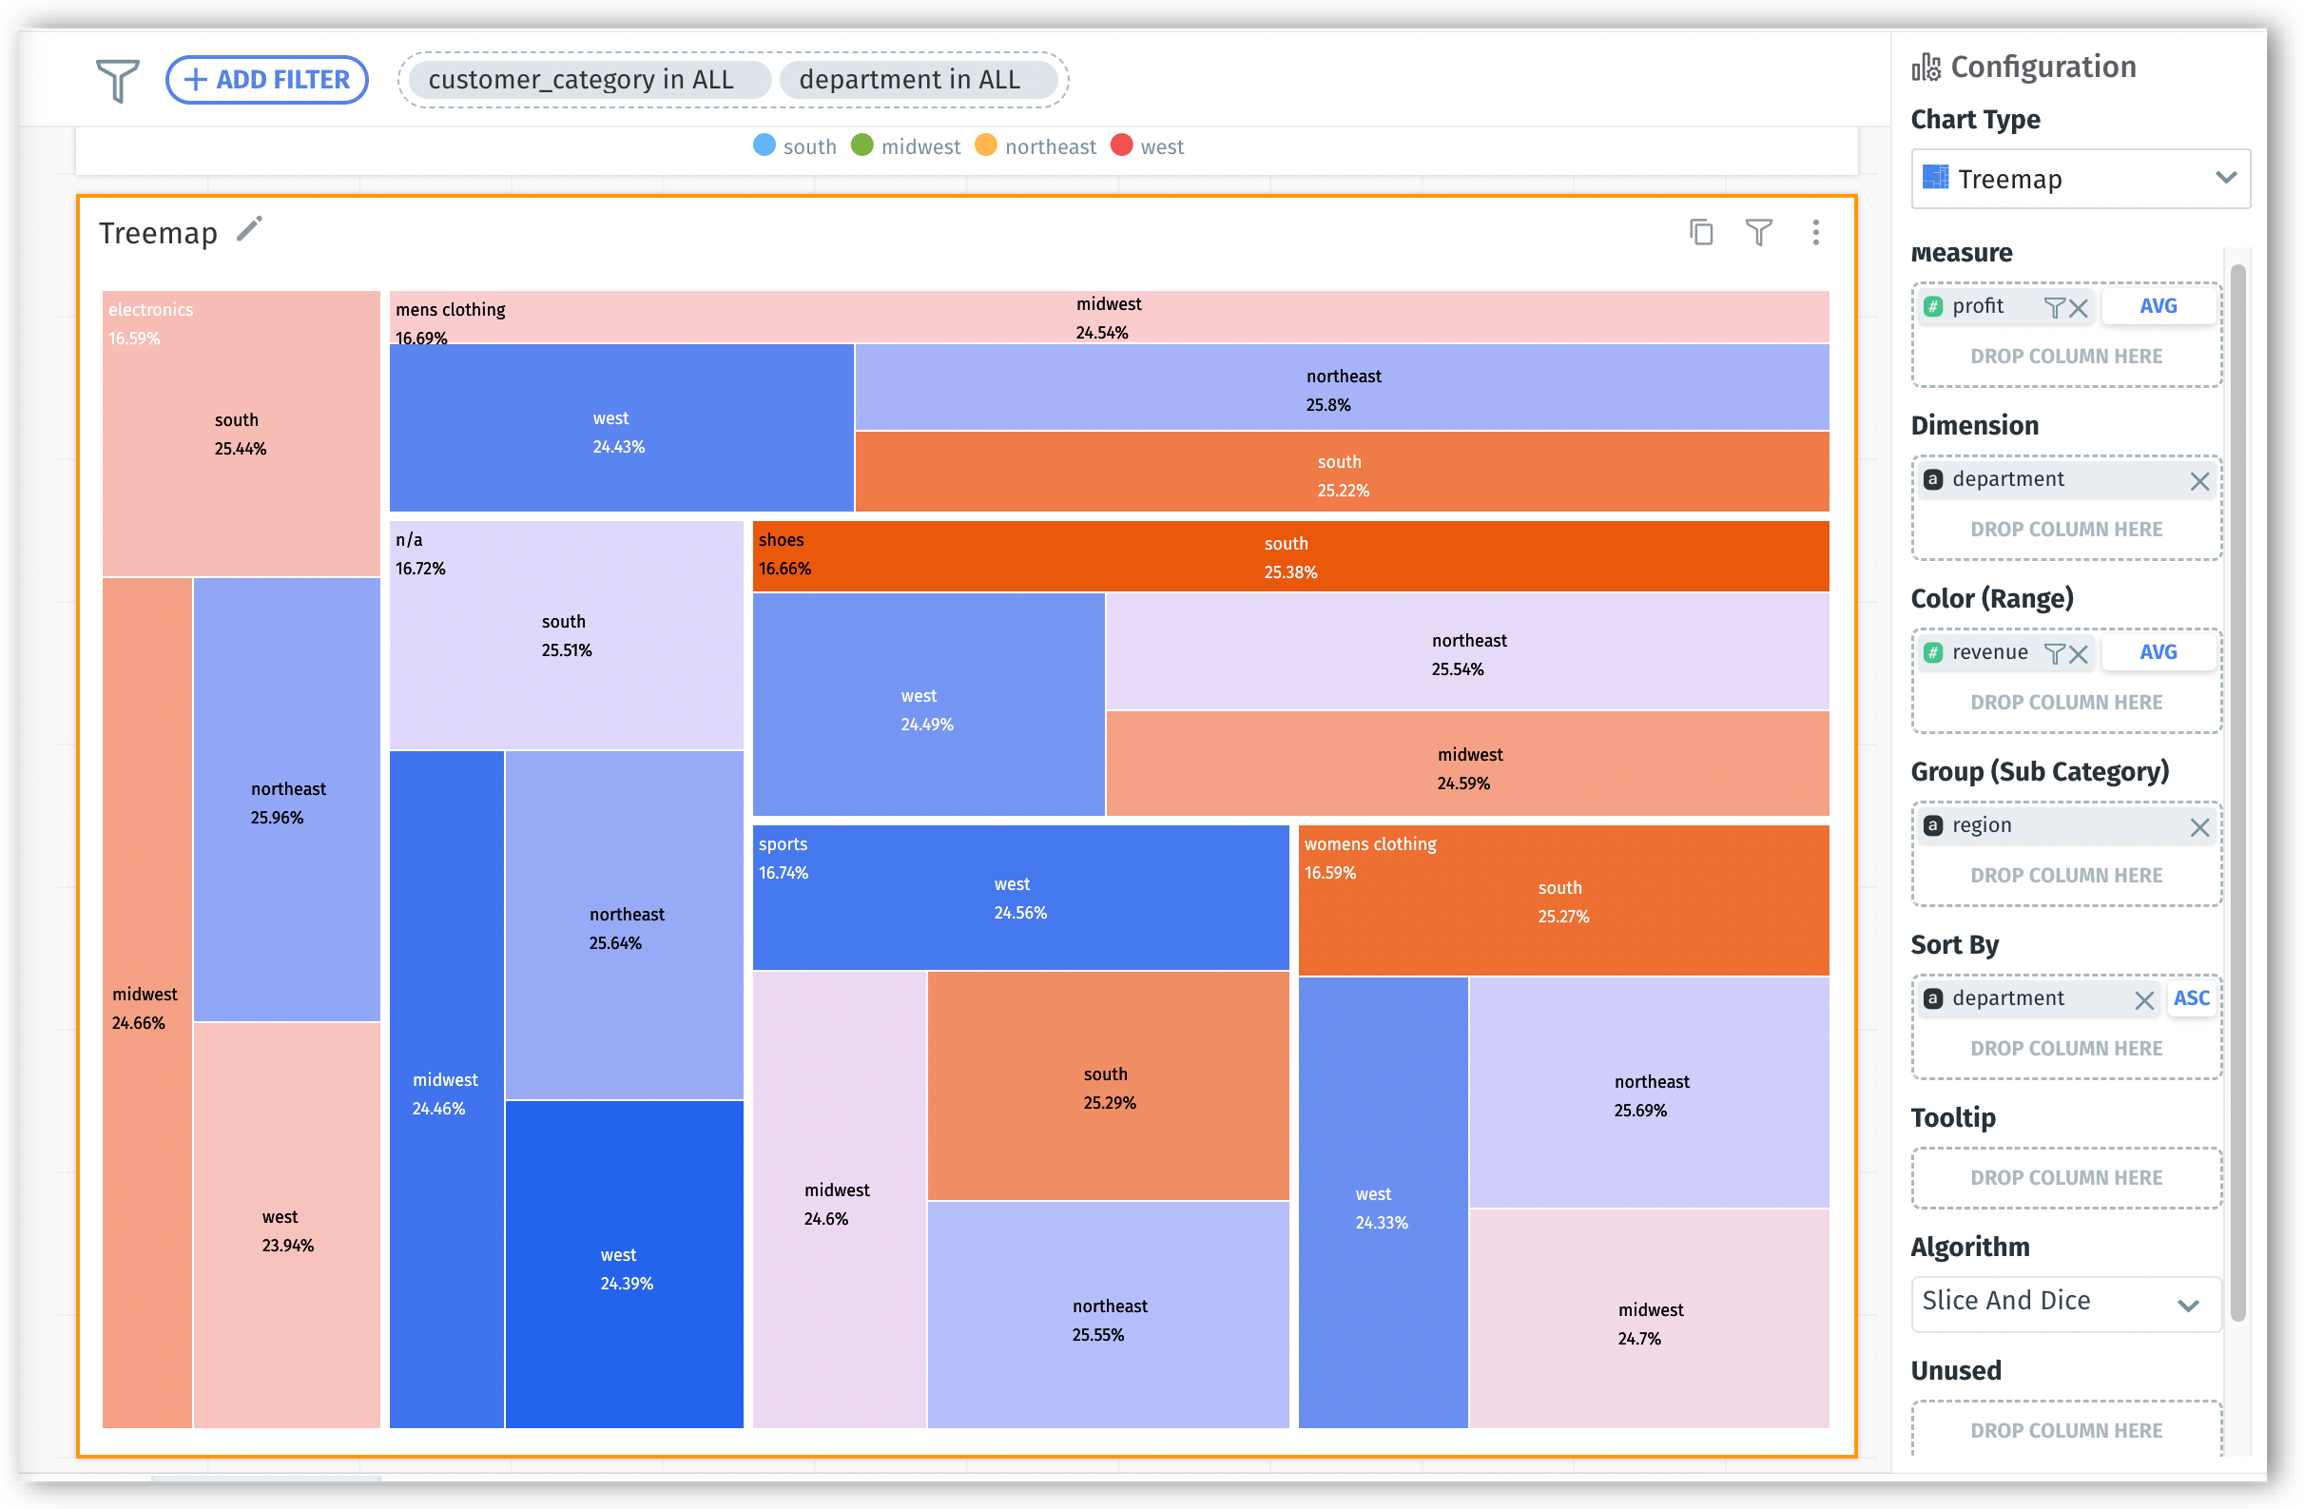
Tree Map:
The new sorting logic highlights data patterns and correlations, simplifying the discovery of insights from complex datasets.
Categories and subcategories are now automatically organized to present a logical flow, enabling rapid comprehension of hierarchical relationships.
Within each category, subgroups are sorted by their respective values, showing their relation with the overall dataset.
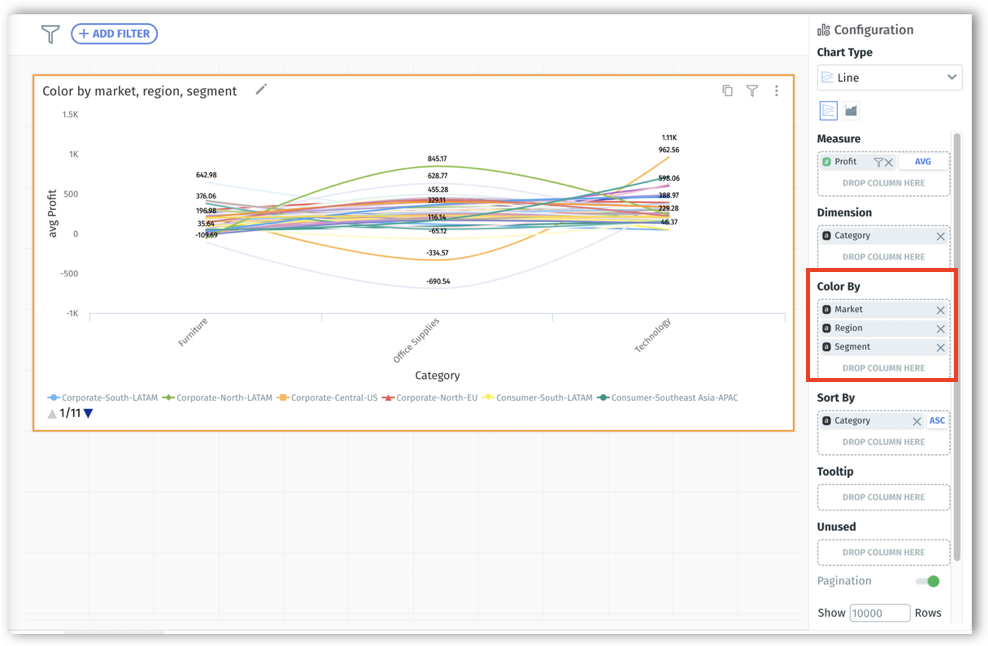
Increasing the layering of “Color-by” fields
Users can now add multiple dimensions (upto 150) in the ‘Color By’ field in line, bar, combo, and area charts, offering a more layered and comprehensive data visualization. The order of dimensions in the ‘Color By’ field can be easily changed to redefine chart visualizations and highlight distinct data patterns.
When adding multiple dimensions, the chart dynamically adjusts to show intricate breakdowns. For example, visualize a line/bar chart with “revenue by year”, broken down by each state, and further divided by gender. This lets users dive deep into each state's gender-specific revenue trends year-on-year.
Simplifying data access with search and sorting
Eliminating the tedious scroll through extensive lists to make selections, we've implemented search and sort capabilities to make data exploration quicker. The search and sort functions significantly reduce the time spent finding specific values and further simplify the data analysis. By minimizing the steps and time taken in data selection, users can focus more on analysis and drawing insights.
Whether you're working with Insights (Segment Driver, Trend Driver, Comparison) or editing aggregations in Search & Vizpad (like Market Share changes or Percentage Changes), you can now effortlessly search and sort through various measures, dimensions, and filter values.
Stay updated with notifications for partial successes
In addition to getting notified about successes and failures, users can opt to get notified about partial successes of refresh and transformation jobs. Under Settings → My Profile, users can now opt to receive email notifications for partial successes.
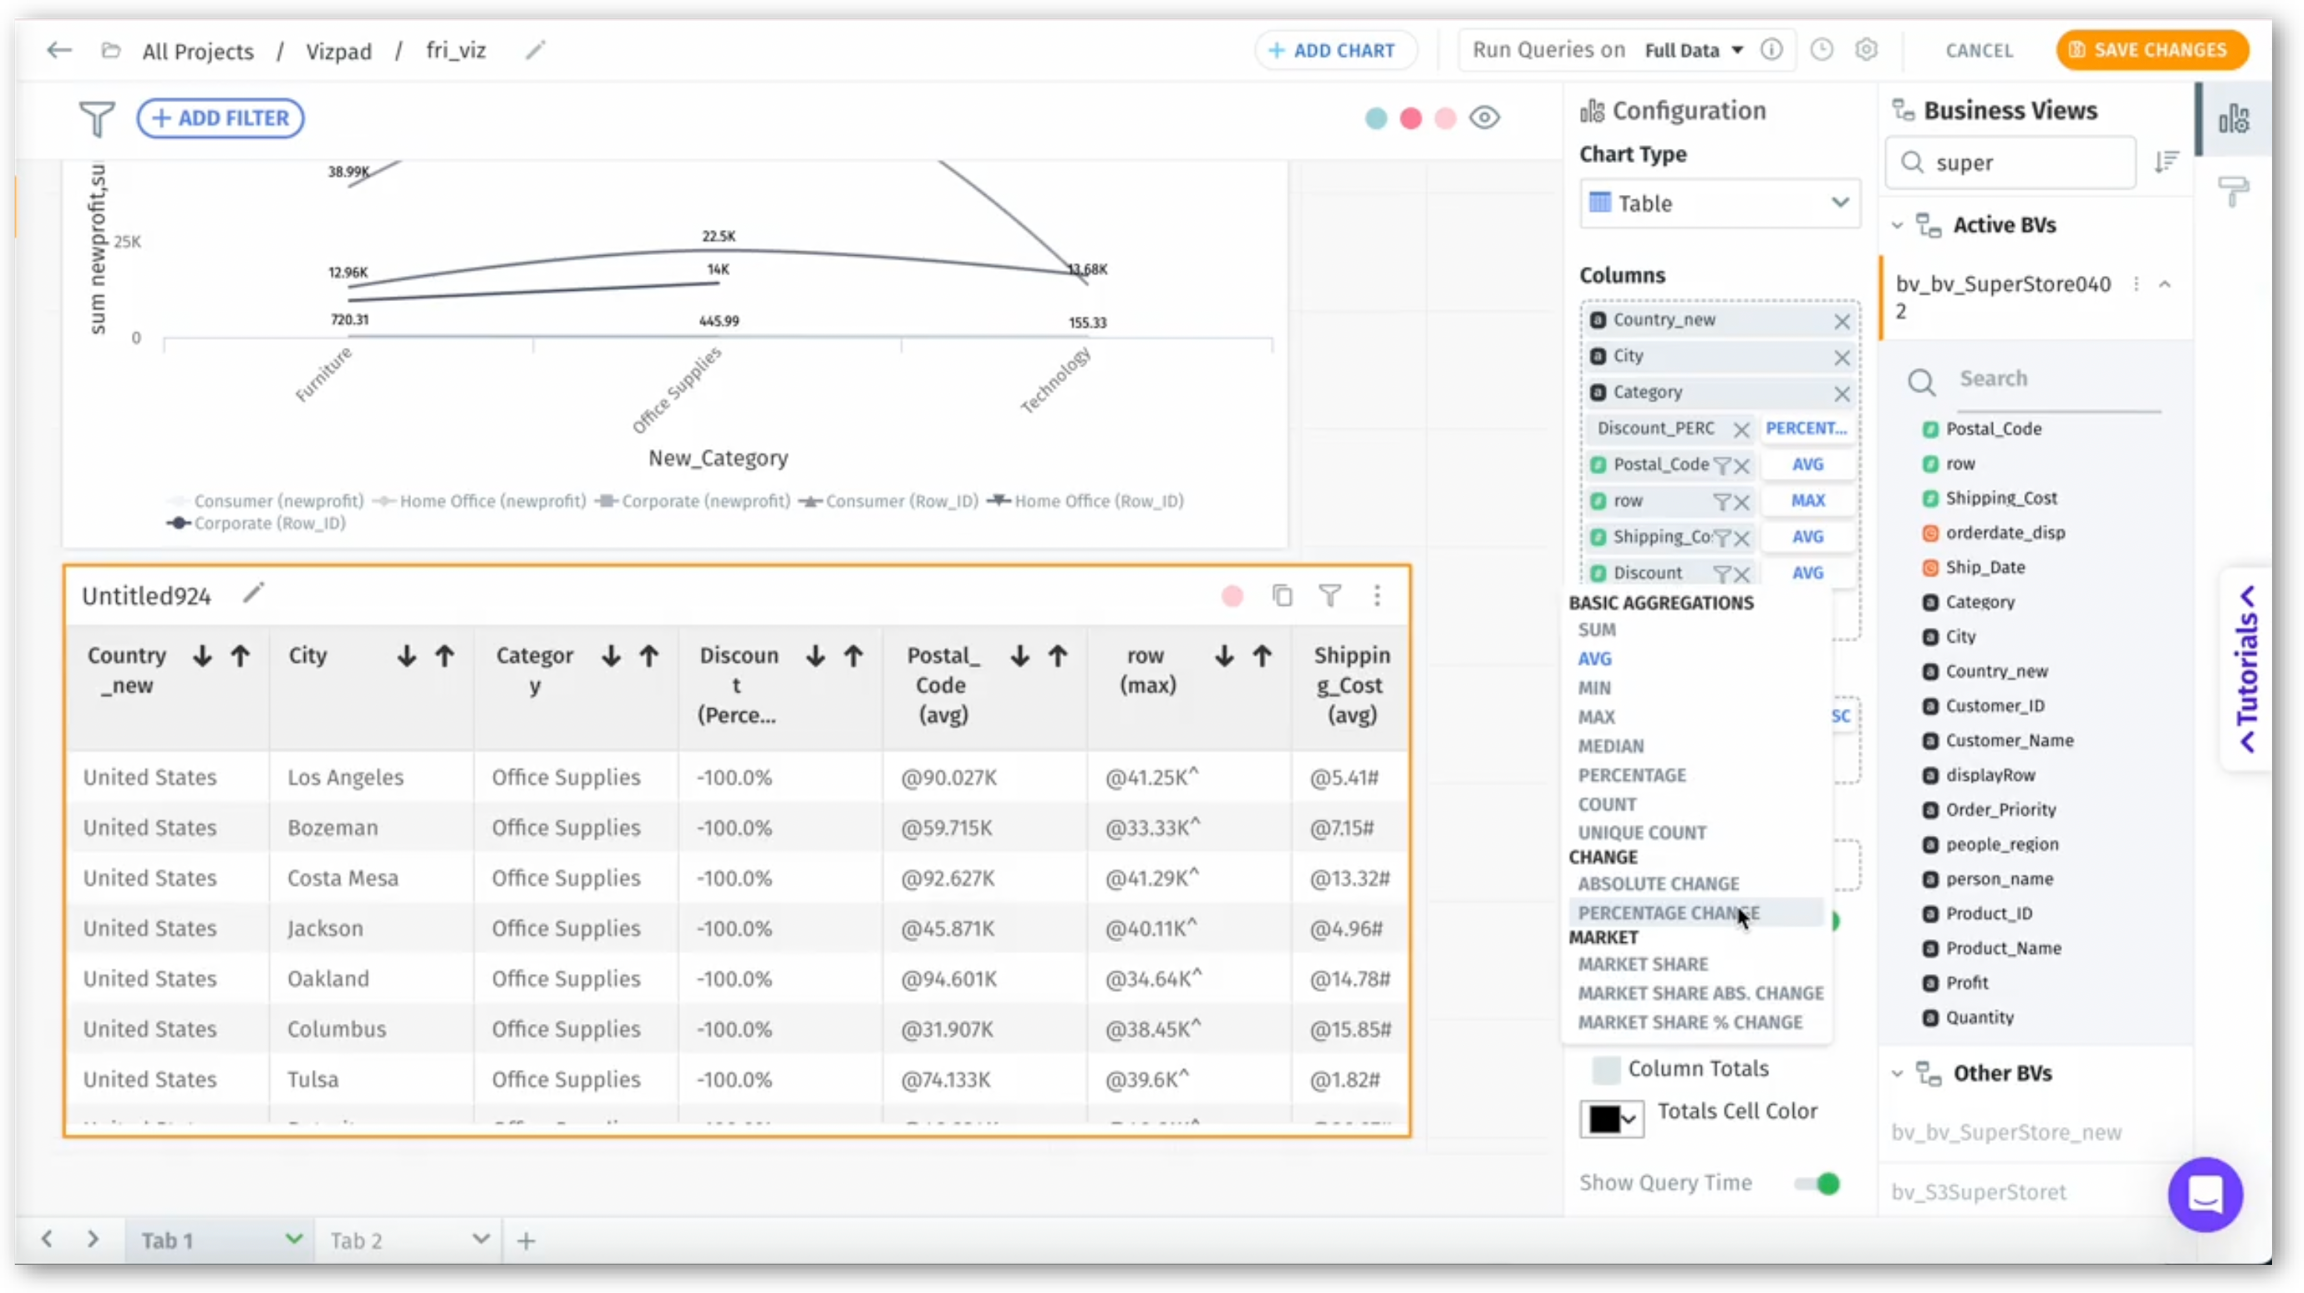
Multiple percentage change aggregations
In Vizpads, introduced the ability to apply multiple Percentage Change aggregations for the same measure in a table chart.
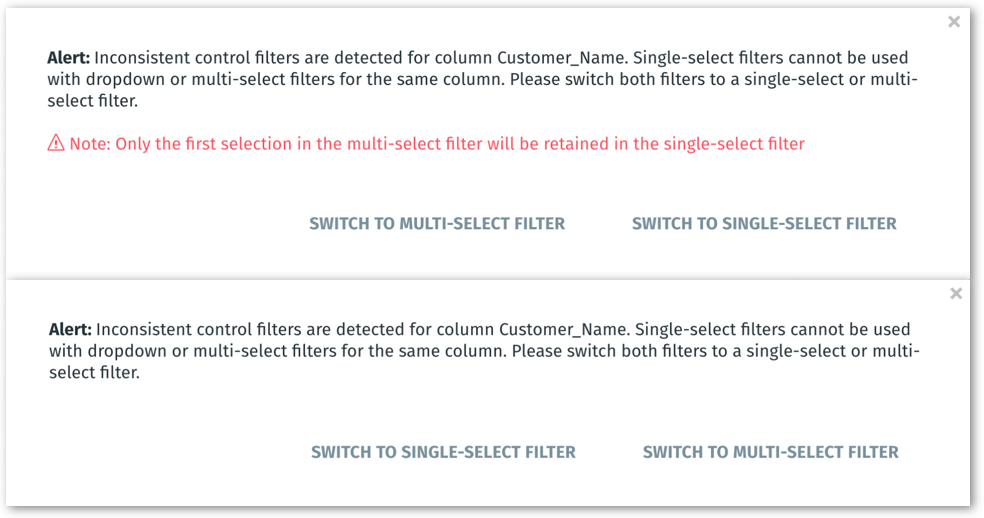
Restrictions for inconsistent control filters
Implemented restrictions to ensure consistent control filter types, preventing the combination of single-select and multi-select/pulldown on the same column. However, the combination of multi-select and pulldown filters is consistent and allowed on the same column. Warning messages will be displayed to users on the addition of inconsistent control filters and ask them to either update the control filter or global filter.
Faster access to refreshed Vizpads
We've enabled Vizpads to repopulate its cache automatically when it expires. Earlier, Vizpad did not cache refresh results, leading to longer wait times to view the updated data. Now, with results being cached, users will experience significantly faster access to the refreshed Vizpad.
Business View descriptions are now automatically generated when a BV is created from datasets or other sources, streamlining the publishing process.
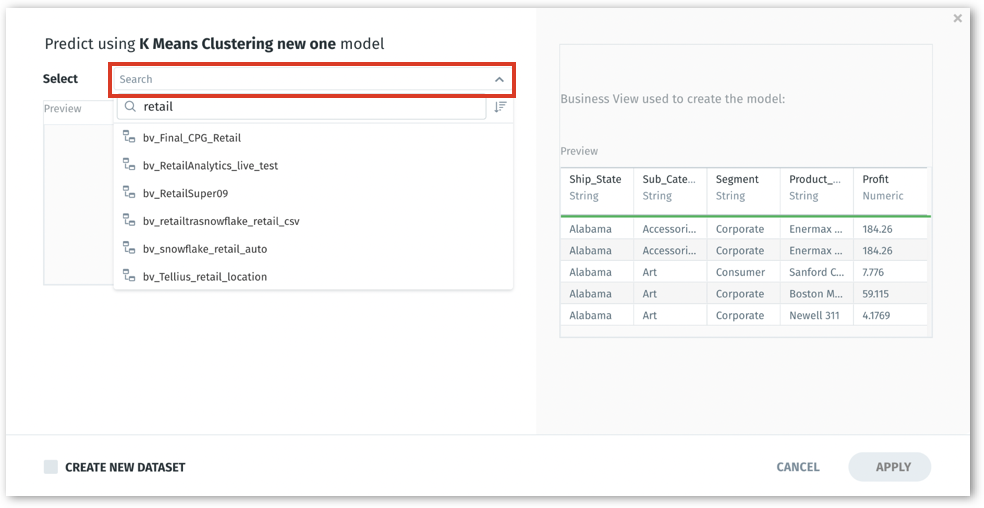
Search Business Views from Predict
A search box has been implemented to search for Business Views while creating models from Predict.
🛡️Security Fixes
In our continued commitment to ensure a safe and optimized user experience, we've introduced the following security updates in v4.3. We recommend users update to this latest version to experience optimal security and performance benefits.
The majority of our microservices have now been migrated to the Alpine-based image for added security and performance.
We've transitioned to a common base image, streamlining our platform and effectively reducing the overall image footprint.
Version upgrades:
Database: PostgreSQL and Redis have been updated to the latest version.
Software: Elixir, Phoenix, and Erlang have been upgraded to their latest available versions.
🛠️ Minor Fixes
Search
To edit any token in a search query, users can now click at any point in the token and make edits seamlessly.
Refined the drill-down functionality when using market share-related search queries or any other aggregations in Search and Vizpads.
The issue with searching and retrieving the Business Views from Favorites and History section has been resolved.
Increased the timeout period for search history queries.
Resolved the unintended display of the configuration side panel during the preview of the Search Guide.
In the Query time breakdown window, the display of Query ID in tooltips has been resolved.
In Search, fixed the issue of improper sorting in tables after changing to view data mode.
Fixed the issue with the display of the side panel after clearing a search result in the search guide.
In Search, addressed the issue with the consistency of the “Reset to Original” feature in the side panel.
Vizpads
The Business View panel list has been improved to be responsive within the Embedding feature, ensuring a better user interface and interaction experience.
The issue with the display of the purple loading bar in Vizpads has been fixed.
In Vizpads, addressed an issue where common columns across different Business Views were not respecting selected values in filters.
In Vizpads, resolved the "Stack by" functionality for area charts.
Fixed the visibility of control lists in Vizpads for users with view-only permissions.
In Vizpads, corrected the display names of explainable charts.
Resolved an issue where Vizpads created with a single Business View had empty Business View ID fields in the data tab.
Resolved an issue preventing the addition of measure columns to pivot tables on double-click.
Implemented wrapping for tooltip texts in tables, improving readability and accessibility of information.
Fixed an issue where shared Vizpads were not being displayed in the Vizpad list.
Addressed the issue that prevents users from adding columns after cloning a Vizpad object and creating a new chart.
In Vizpads, the issue with rendering pivot tables when adding comparison filters with marketshare absolute/percentage change has been resolved.
Fixed an issue with sorting functionality when a date column is added to the "Group by" bucket in Vizpads.
The performance issue with using more than three columns for pivot tables has been fixed, ensuring smoother and more efficient data handling.
In Vizpads, resolved the issue where changing configuration or column pagination in a pivot table did not initialize row pagination.
In Vizpads, added backward compatibility for filters with empty array values.
In Vizpads, resolved sorting issues in tree maps when the dimension is a date column.
In Vizpads, the issue with embedding filters by post message when global filters are applied has been fixed.
The issue with the comma-separated values on a calculated column not getting reflected in Vizpad charts has been resolved.
The issue with updating the display names of columns after swapping Business Views in Vizpads has been fixed.
In Vizpads, the issue with removing and adding boundary columns in boundary maps has been fixed.
In Vizpads, removed the unnecessary scroll bars appearing in table/detail/pivot charts even when there was sufficient space.
In Vizpads, addressed the issue where the export of PPT/PDF was failing due to a version upgrade.
In Vizpads, resolved the issue with “Blank" and “Not blank” operators not working when Integer type dimensions columns are used in filters.
Resolved a UI issue with selecting a gradient color range in Vizpads.
In Vizpads, modified the syntax of legends for Year-Over-Year (YOY) charts and removed the display of additional legends.
Resolved the issue with applying time filters in Search/Vizpad for live Business Views.
The issue with changing color for customized divergent charts from global settings has been resolved.
In Vizpads, resolved tooltip display issues and colour change functionality problems for boundary maps.
In Vizpads, fixed the issue with adding a measure to the "Color by" field for scatter charts.
In Vizpads, resolved a lag in displaying columns when switching between different Business Views.
In Vizpads, fixed the issue with displaying the active Business View name in side panel when switching between charts.
In Vizpads, fixed the issue of displaying the column names of the selected Business View after canceling an action and editing again.
In Vizpads, added support for applying two time filters on a single line chart.
Resolved the rendering issue with some charts in Vizpads created in older versions.
In Vizpads, resolved the issue with adding dimensions in the Configuration pane for YoY (Year-over-year) charts.
In Vizpads, fixed the issue with searching and displaying relevant column values in filters.
In Vizpads, resolved the issue with exporting PPT files of boundary maps.
Resolved issues with ascending and descending sorting in table and detailed table charts of Vizpads.
In Vizpads, fixed issues related to dragging and dropping dimension columns into the fields for pivot and table charts.
In Vizpads, addressed a bug where columns could not be added in a cloned Vizpad.
In Vizpads, resolved an issue where switching between "View data" and charts in a Viz was occasionally not working properly.
In Vizpads, resolved the delay in reflecting formatting changes in charts when marketshare aggregation is used for a measure column.
In Vizpads, fixed the issue where a cloned Vizpad did not retain columns selected in the previous Vizpad.
Addressed the scroll issue in the multi-list column filter in Vizpads.
In the Edit mode of Vizpads, enhanced the alignment of bullet points for text viz.
In Vizpads, fixed the highlighting of the selected operator in the dropdown list of "Remove" filter pill.
In Vizpads, addressed the issue with irrelevant text getting appended when hovering over the sort icons in table charts.
The issue with adding calculated columns to combo charts in Vizpads has been resolved.
The functionality issues with scatter, treemap, confidence range, and KPI target charts have been fixed.
Fixed the display of “Not in” operator and its values in advanced filter pop-up while editing Vizpads.
In Vizpads, resolved scrolling issues in the Business View panel when selecting columns.
Fixed the issue of displaying placeholders during the loading of Vizs.
In Vizpads, resolved the issue with creating cohort charts from a newly created Business View.
In Vizpads, removed ellipsis from Y-axis tooltips for charts.
Resolved the issue with the visibility of hyperlink pop-ups in Vizpads.
In the explainable AI charts of Vizpads, the issue with displaying the relevant Business Views for the ML-Models has been resolved.
In Vizpads, improved the updating mechanism of slider viz control values for different operators.
In Vizpads, disabled the non-functional data labels option for cohort charts in the Formatting panel.
Fixed overlapping of legends for both bubble and heatmap charts in Vizpads.
The issue with the X-axis title not getting reflected in the bubble chart's X-axis formatting section has been resolved.
Insights
In the "Why" tab of trend driver Insights, the visualization has been corrected to filter and display data as specified in the user inputs.
Resolved issues with the drag and drop feature in Insights configuration.
In Insights popup, fixed a bug allowing users to remove date filters added from Search/Vizpads.
Updated the placeholder text from "Select or Start Typing" to "Select" for fields in Insights configuration, market share, and percentage change pop-ups.
In Insights, corrected an issue where swapping Business Views still showed the old Business View name.
Resolved the unexpected closing of Insight creation popup while scrolling.
Addressed the issue with moving a column from Included to Excluded during new Insight creation.
In Insights, fixed the issue of displaying the contributor details when hovering over the last contributor.
In Trend and Comparison Insights, resolved the issue of displaying incorrect Business View name in the "Understand why" section after swapping.
In Insights, the issue with switching between "Equal to" and "Not Equal to" filters has been resolved.
In Insights creation page, the issue with selecting the column type after choosing measure or dimension has been resolved.
In Trend and Comparison Insights, addressed an issue where "undefined" was displayed for column-level formulas in the column selection.
The issue with selecting a range for date columns while creating Comparison Insights has been fixed.
Added validation and tooltip for Aggregation dropdown while creating Trend and Comparison Insights.
In Insights configuration, resolved the issue where editing the date range in Edit mode also affected the View mode.
Models (Predict)
In time series regression models, fixed the missing radio button "All" option in the "Select columns to predict".
Resolved an issue preventing the addition of filters in Models.
In Models, fixed an overflow issue in the display of the user name in the Point and Click feature.
Fixed the visibility of the target column in the Auto-ML page when a column name has a display name.
Data
Fixed a bug where refreshing scripted datasets was inadvertently clearing all parent source caches.
Fixed an issue where email notifications configured at the user level were not being sent out for scheduled refreshes.
Implemented formatting for numeric values in dimensions to prevent exponential display.
Improved error handling when refreshing datasets and encountering missing columns, specifically where the missing column was used in a calculated column.
Fixed the filtering functionality within folders on the dataset page.
In the Data → Prepare page, the issue with displaying relevant folder contents after searching/filtering has been fixed.
Resolved the issue with loading BigQuery datasets and publishing Business Views when the dataset contained BigNumeric data type.
Fixed the issue of listing Business Views for model prediction when one of the Business Views had a BigNumeric column type.
Addressed an issue where partial success in dataset refresh showed duplicate notifications.
Reduced loading time and enhanced the performance of the Prediction tab in Data → Business View.
Fixed the content alignment issue in the dataset delete popup.
Removed the linking functionality from the dataset copying process.
In data preparation page, addressed the issue of displaying empty nodes in the visual pipeline upon renaming datasets.
Provided a warning message when moving away from edited calculated columns without publishing or canceling.
Addressed design issues in the preview results of newly created calculated columns.
In the data preparation page, fixed the formatting issue where converting a double measure to a string resulted in exponential value change.
Addressed an issue where text was clipped for object names in the delete popup.
Fixed an issue where icons were not displayed for Delta Lake files.
Removed redundant pop-ups appearing post successful saving of datasets.
Fixed the UI validation for naming the calculated columns.
Resolved the issue with displaying shared usernames and the Share button of a shared Business View.
In the data preparation page, provided error messages for returning empty datasets and failure of previews.
Addressed the absence of an alert message when duplicate display names were added in the Metadata tab.
In the data preparation, corrected an alignment issue in the Add Column popup.
In the data preparation page, improved the tooltip visibility when hovered over sorting icons.
In the Datasets page, resolved the issue with pagination after renaming datasets.
The issue with disabling the schema validation for the refresh of file-based sources has been rectified.
In the data preparation page, fixed an issue where tooltips were not appearing when hovering over sorting icons.
In the dataset page, fixed the display issue when hovering over long text in the custom SQL popup.
Resolved the issue with table name visibility when saving and browsing hosts for Snowflake OAuth.
In Data → Prepare page, resolved issues with tooltips when hovered over datasets.
Fixed redirection issues to scripted datasets from the Business View page.
In the Scripting tab of the data preparation page, fixed the incorrect display of certain dimensions as measures.
In the code library, added ellipsis for lengthy column names for better readability.
In the data preparation page, fixed the UI issues in displaying the calculated columns table on scroll.
For a Business View, refined the validation process for display names, allowing reuse after removal.
Feed
Addressed the issue where Feed creation failed for predefined date filters.
Rectified the issue of selecting a date filter in the Feed creation popup.
Addressed Feed creation and column selection issues related to market share aggregation.
In the Feed creation window, improved the clarity and consistency of validation messages related to aggregation.
In the Feed creation window, resolved alignment issues with filter columns and values.
In the Feed creation window, fixed the display name of a column during the selection of measure columns.
Miscellaneous
Corrected the placement of the sorting icon on the Assistant page.
Fixed an issue where the primary Business View name was not displayed in Projects created from the onboarding flow.
The issue with displaying the updated Project name after renaming/editing has been fixed.
In Notifications, fixed the redirection of the "View" button to the relevant “Prepare” page for "Update to Data Transformation" job types.
In Notifications page, corrected the display of object names for fusion datasets.
Fixed the missing time range display when re-configuring failed Trend Insight from the Notifications page.
Last updated
Was this helpful?