Vizpads
Configure Vizpad settings to optimize performance, manage filters, and customize chart summaries for efficient visualization of large datasets.
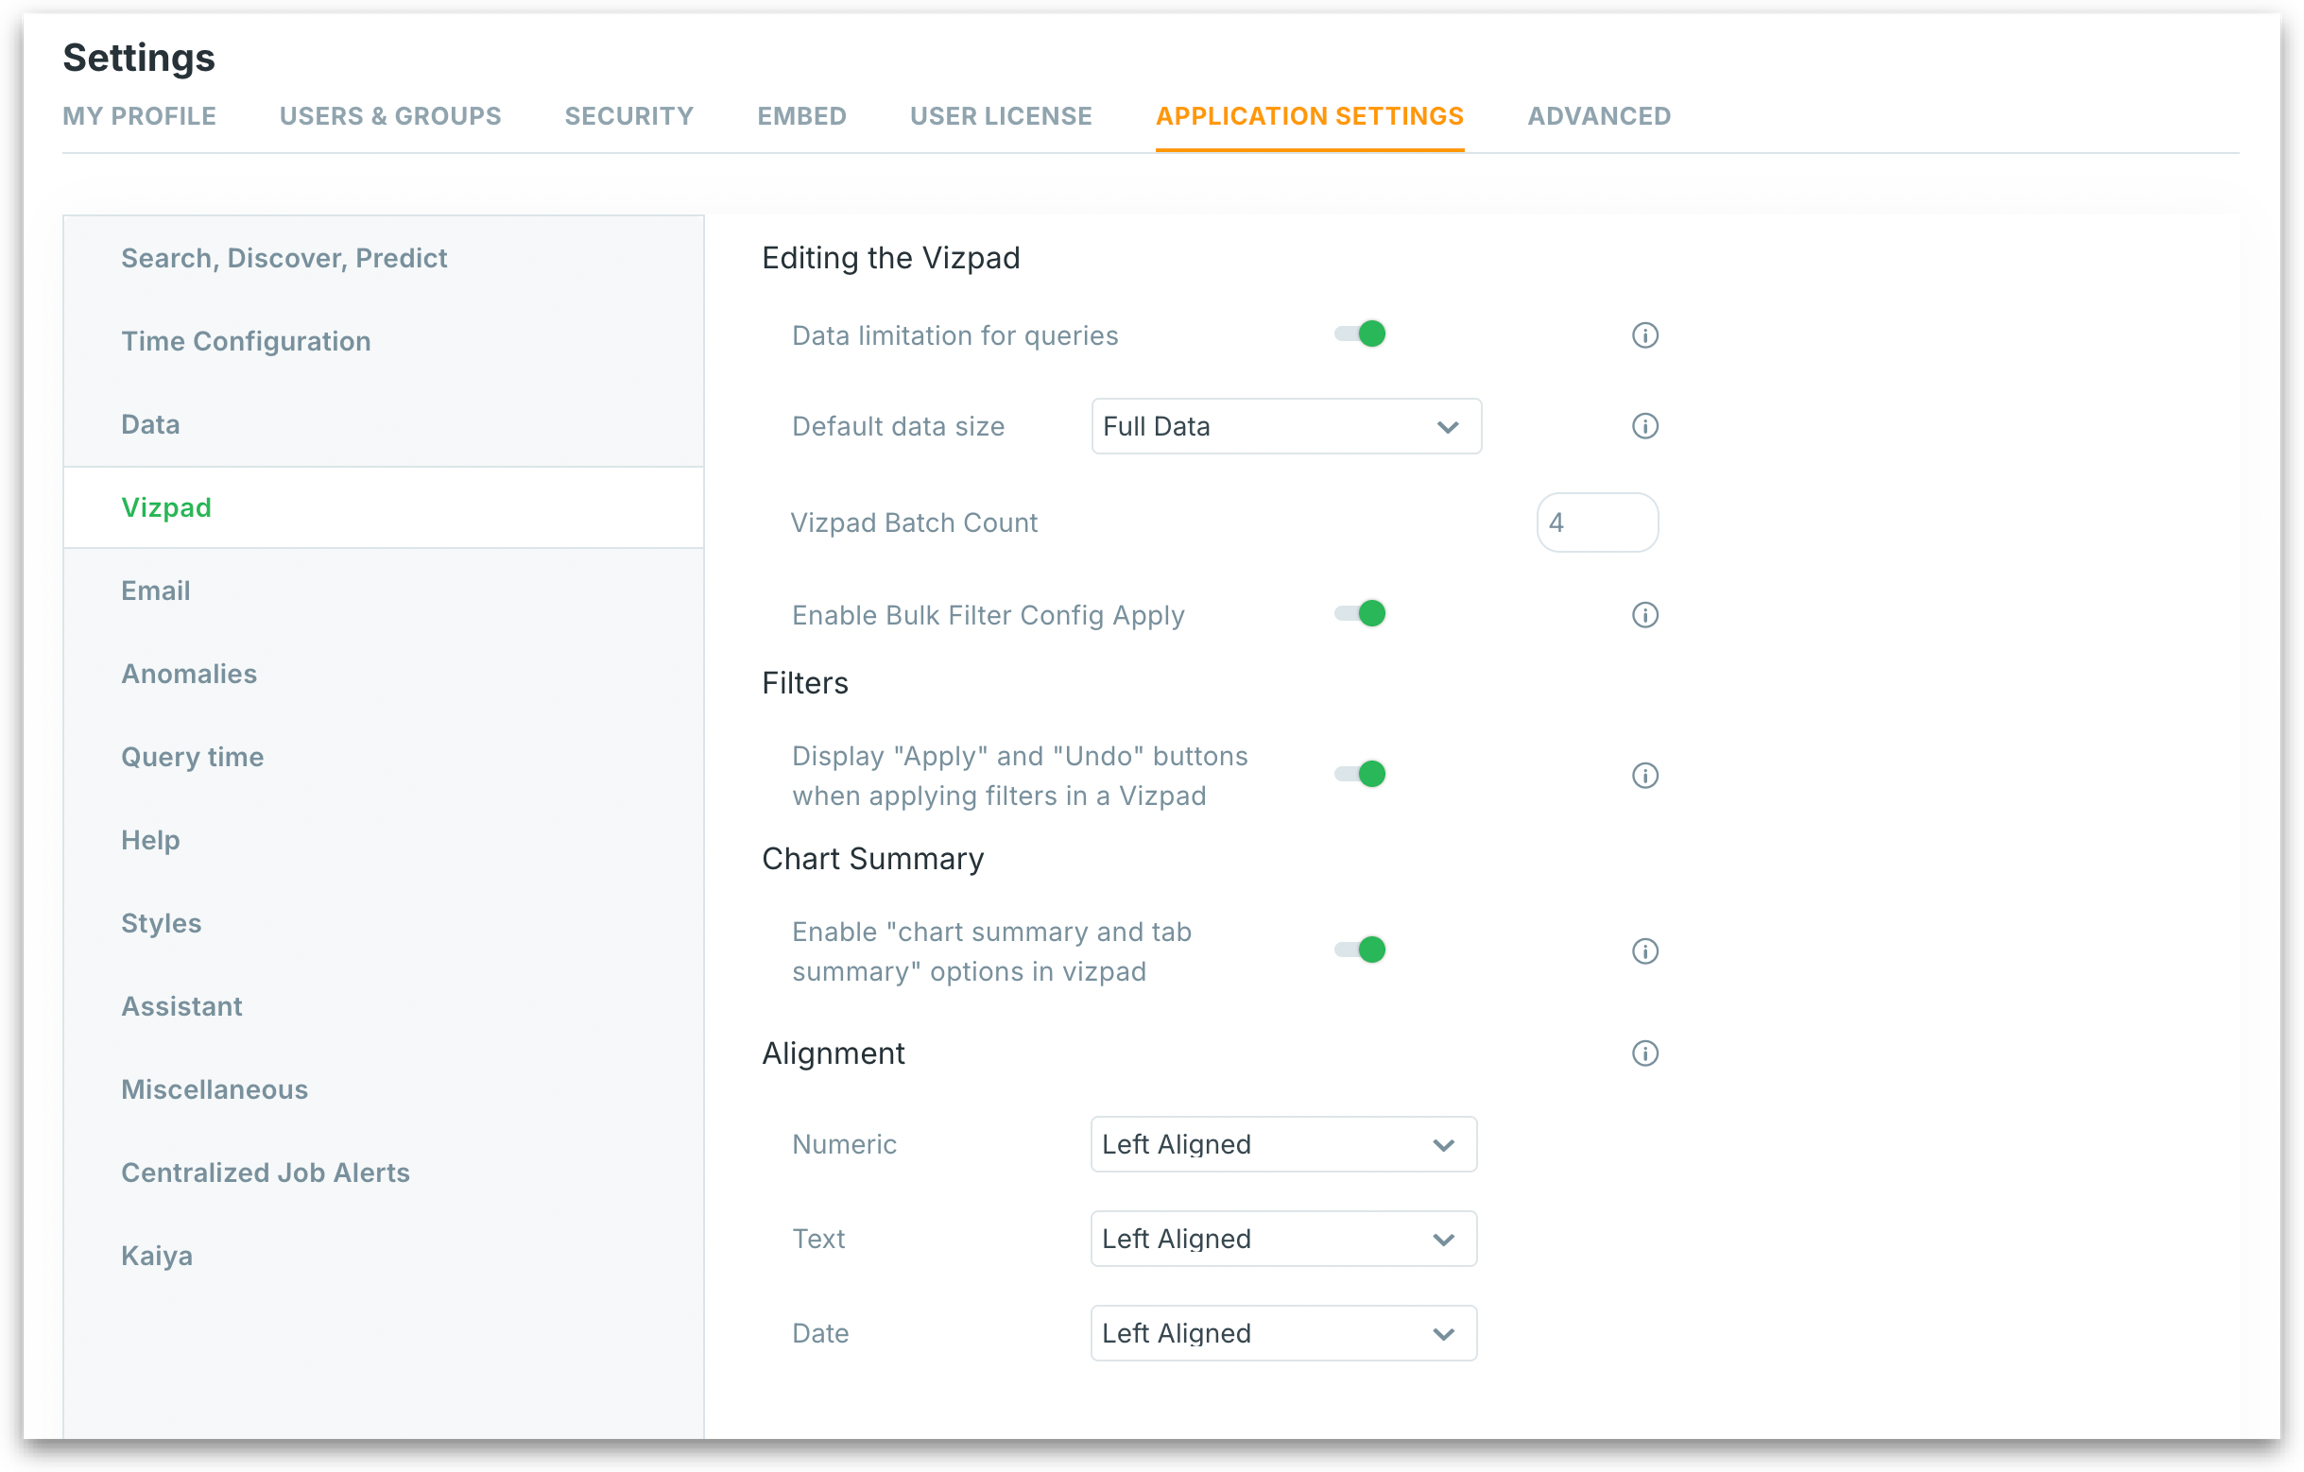
Under Settings → Application Settings → Vizpad, admins can fine-tune how users interact with visualizations and filters, especially when working with large datasets or live data connections. Below is a breakdown of each configurable option:

Editing the Vizpad
Data limitation for queries Limits the number of records fetched per query to improve performance and reduce latency. This helps avoid performance issues when querying large datasets.
Default data size Controls the default mode to load data in Vizpad Edit mode. When enabled, a dropdown appears allowing users to toggle between:
Sample Data: Queries only a subset of the dataset for faster performance. Ideal for large or live-connected datasets.
Full Data: Queries the entire dataset for more accurate results.
By default, "Sample Data" is selected.
Vizpad batch count Defines how many charts or widgets get rendered in one batch when loading a Vizpad. A lower number optimizes load time and reduces resource strain on large dashboards.
Enable bulk filter config apply Enables a staging mode for applying filters in the Configuration pane. Useful for large or live dataset—by reducing the number of backend calls. Instead of updating the chart after every single filter adjustment, users can:
Apply all filter changes at once.
Undo recent changes before applying.
Filters
Display "Apply" and "Undo" Buttons When enabled, this option adds Apply and Undo buttons under "Apply Filters" in the Vizpad.
Users can select multiple filter values before applying them, preventing intermediate queries from triggering each time a value is changed.
Especially helpful for live connections or datasets with performance sensitivity.
When disabled, filters are applied immediately after each selection, which works well for small or cached datasets.
Chart Summary
Enable "Chart Summary and Tab Summary" If enabled, users can choose to generate customizable summaries for charts (summarizes individual charts) and tabs (summarizes tabs consisting of multiple charts) of Vizpads.
Alignment
Sets the default text alignment (left, center, or right) for different data types in Vizpad tables:
Numeric: Align numerical values.
Text: Choose default alignment for text fields.
Date: Control alignment of date values for clearer time-based visualization.
Was this helpful?