Dynamic metric matching
Create context-aware dynamic metrics that replace long CASE WHEN logic in Tellius, automatically adapting calculations based on grouping levels and filters.
Business users often need a single metric that adapts to context—for example, calculating sales differently when grouped by country, region, store, or when filtered by Premium customers. Traditionally, this logic requires long CASE WHEN trees that run sequentially in the database. These not only degrade performance but also become hard to maintain, error-prone, and unreadable.
The dynamic matching framework lets you collapse that complexity into a single intelligent definition. At runtime, Tellius inspects the grouping levels and active filters in your query and automatically selects the correct logic branch—no code rewrites, no risk of missing conditions, and no slowdowns.
What you’ll notice immediately
Performance boost: Skips complicated nested
CASE WHEN.Cleaner logic: One dynamic column instead of dozens of hard-coded metrics.
Context awareness: The metric understands grouping levels and active filters.
Future proofing: New hierarchy levels or filter combos can be added with a single extra line.
When should you use dynamic metric match?
Use it whenever the correct business rule changes based on:
The column(s) in GROUP BY (Country → Region → City → Store hierarchies, Product → Brand etc.)
The presence or absence of filters (e.g., Premium flag, current-quarter flag).
Situations where multiple hierarchies interact and you would normally create a huge decision tree.
How to create a dynamic metric?
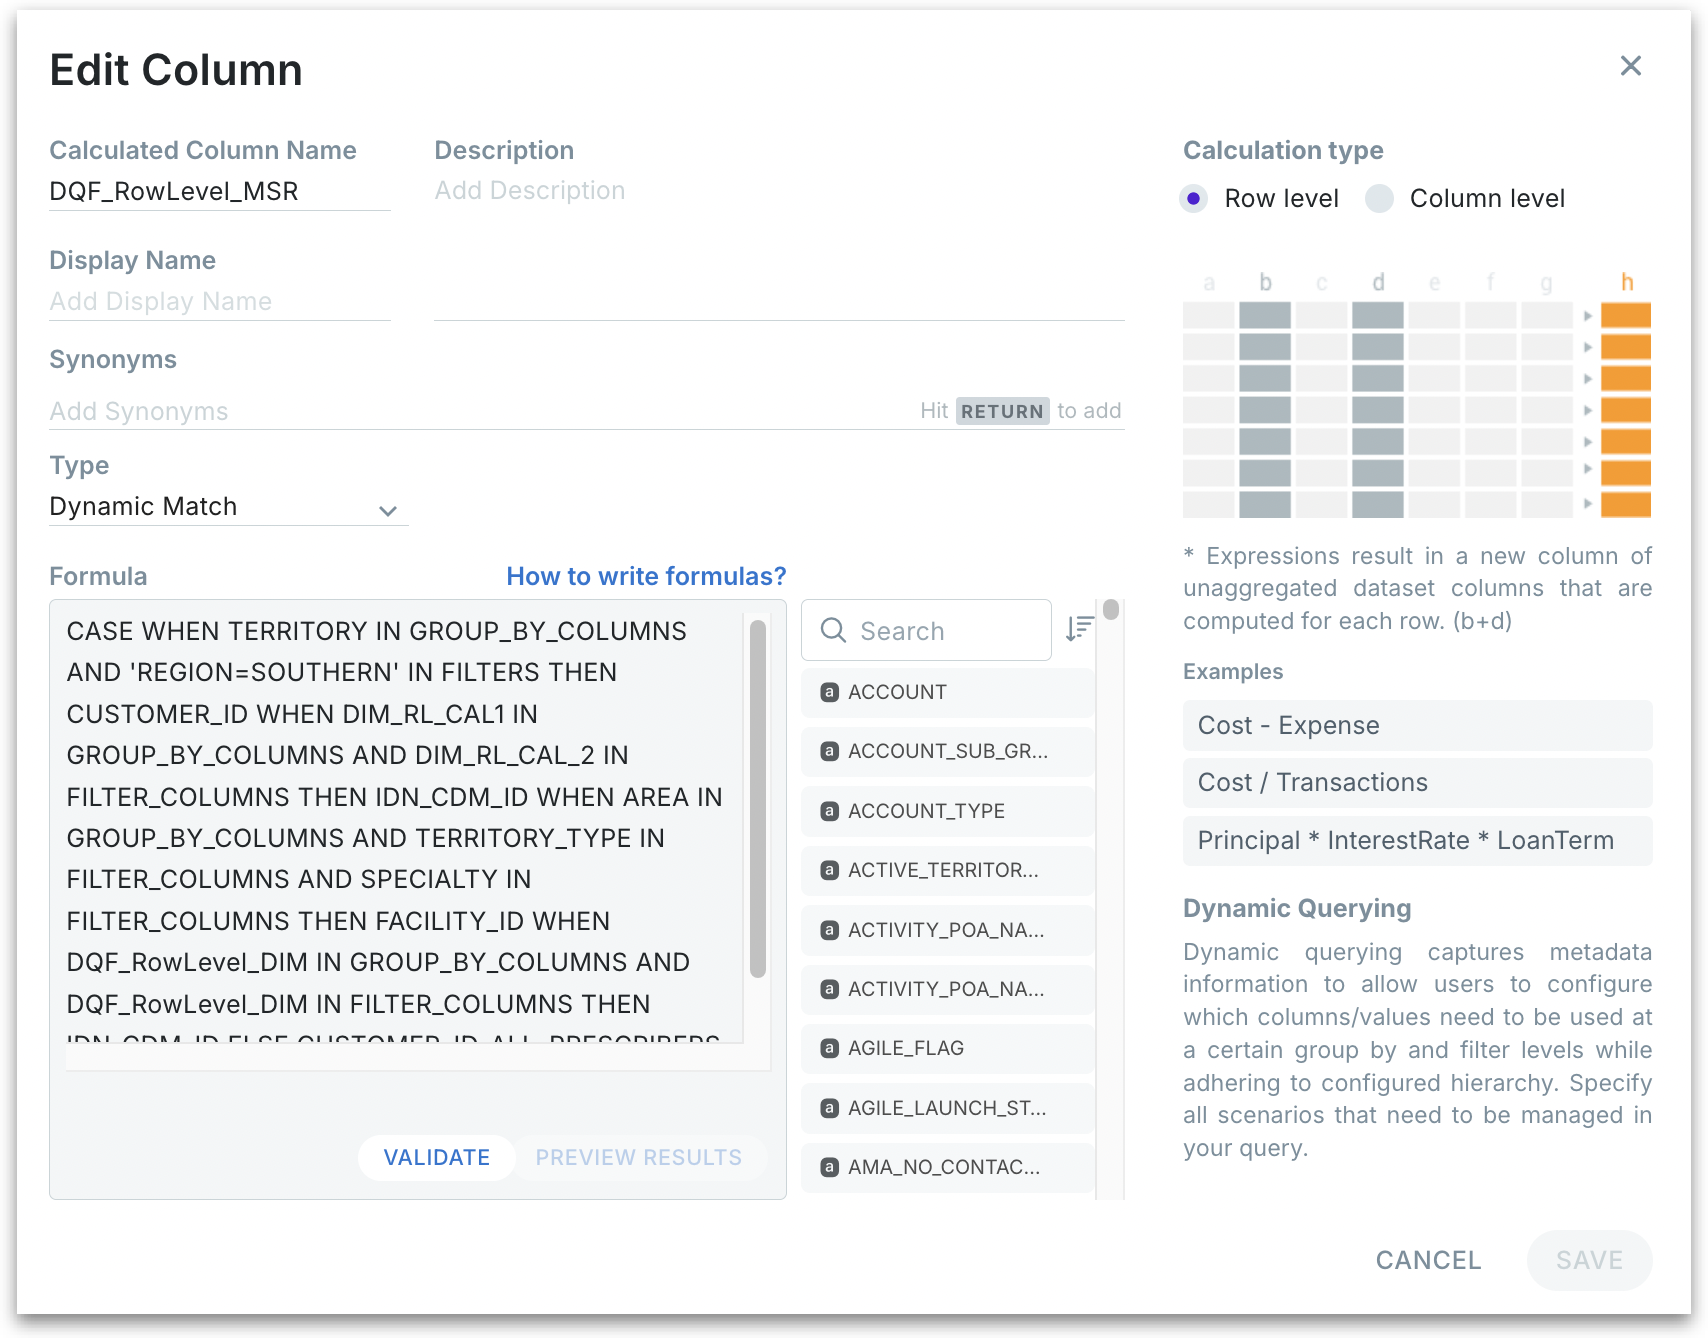
Under Data → Business Views → Calculated Columns, select Edit → Create new calculation.
Provide the following details:
Calculated column name: Provide a name that clearly reflects the logic or purpose of the metric.
Description: Explain the purpose, logic, and intended use of the dynamic metric.
Display name: User-facing label shown in charts and insights.
Synonyms: Optional alternative names that help users discover the metric when using search or Kaiya in natural language queries (e.g., in Kaiya).
Type: Choose Dynamic Match from the dropdown.
Calculation type: Dynamic metrics can be applied at two levels, depending on the nature of your business logic:
Row-level dynamic logic Applies the dynamic rule individually to each row in the dataset. This is ideal when your calculation needs to account for row-specific attributes, such as adjusting a score, price, or risk metric based on that row’s values and context.
Example: Risk scoring that varies by patient segment and diagnosis codes.
Column-level dynamic logic Applies the dynamic rule at the overall metric level, determining one calculation path for the entire query based on filters or groupings. This is useful for use cases like adaptive KPIs or region-specific aggregations that should shift depending on how users slice the data.
Example: “Sales” metric switches between
Sales_Store,Sales_Region, orSales_Premiumdepending on grouping and filters.
Choose row-level logic when the calculation varies within a visual or table.
Choose column-level logic when the metric logic changes based on how the data is grouped or filtered overall.

How to write a formula?
Recognise the pattern. Every dynamic metric is just a tidy
CASEblock:Write your conditions from most-specific to most-general. The first match wins. The following is the anatomy of a condition
… IN GROUP_BY_COLUMNS– fires when that field is part of the visual’s grouping. E.g., Region in GROUP_BY_COLUMNS.'X = Y' IN FILTER– looks for an exact filter string in the query. E.g.,'Customer_Type = Premium' IN FILTERColumn IN FILTER_COLUMNS– checks whether the column (not the value) is filtered. E.g.,Customer_Type IN FILTER_COLUMNSreturns true if any filter exists on that column.
Supported Syntax
Operators:
=,!=,<,>,<=,>=,IN,NOT IN— must include spaces ✅AREA = WEST❌AREA=WESTParentheses required for
IN/NOT INexpressions ✅AREA IN (EAST, WEST)❌AREA IN EAST, WESTString filters must match exactly, including spacing and operators ✅
'SALES > 1000' IN FILTER✅'AREA NOT IN (WEST, EAST)' IN FILTERUse only single quotes in filter expressions. Please do not use double quotes. ✅
'REGION = SOUTH' IN FILTER
Validate your syntax with the built-in syntax checker, then test in Search, Kaiya or a Vizpad.
Syntax – Click Validate in the editor (checks spacing, operators, field names). Once the validation is done, click on Save. Click on Publish and the created dynamic metric will be added.
Logic – Ask natural-language questions: “Show sales by store for premium customers” → framework should pick
Sales_Store_Premium.Vizpad – drop the metric into a chart, switch from Region to Store, toggle filters, watch values update.
You can also use the Search Inspector to view how conditions were evaluated and which logic path was applied at runtime.
If the wrong branch fires, check the order of conditions and confirm the filter string exactly matches what appears in the filter pill (including spaces and operators).
Viewing dynamic match details
Once a dynamic metric is used in Vizpads, Search, or Kaiya, users can view which logic branch was triggered during the query. Helpful for debugging and ensuring your rules are matched as expected.
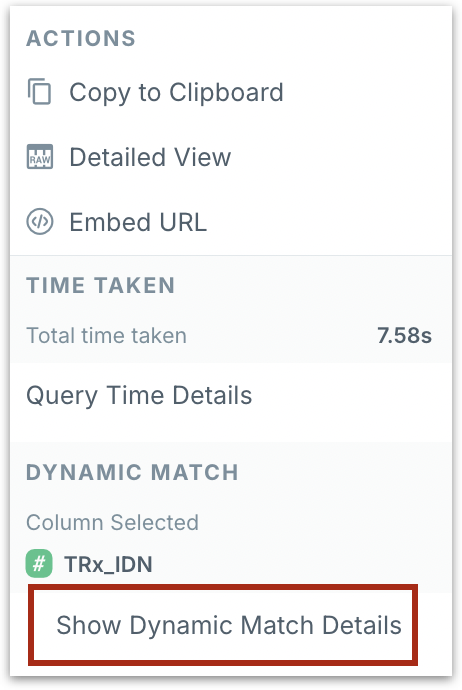
In any chart using a dynamic match, click the ⋮ three-dot menu on the chart. The following menu will be displayed and select "Show Dynamic Match Details".

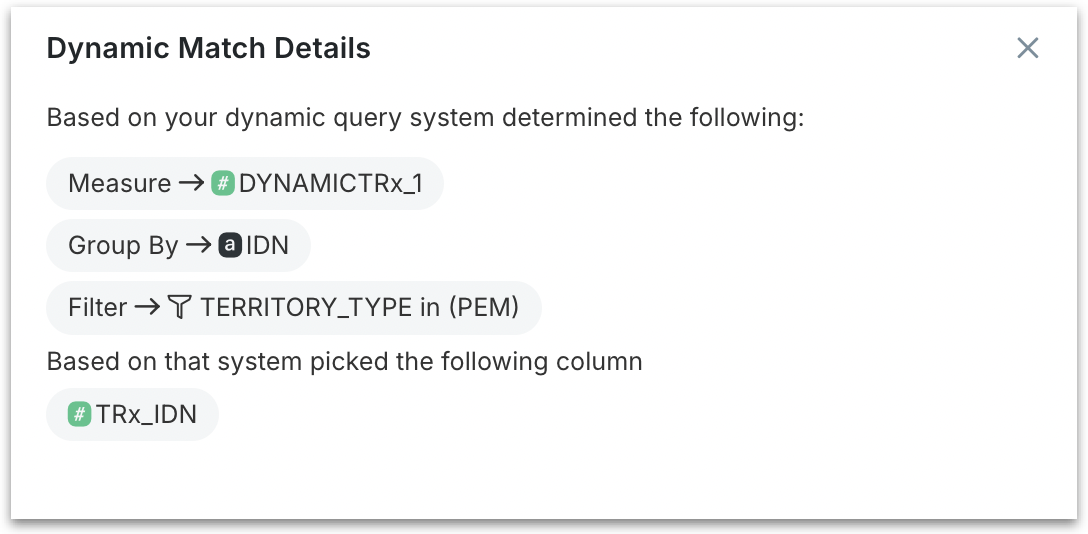
The following window shows the exact context that influenced the query logic.

Measure → The dynamic metric being used (e.g.,
#DYNAMICTRx_1).Group By → The grouping column(s) active in the query (e.g.,
IDN).Filter → Any filters applied that impacted the logic (e.g.,
TERRITORY_TYPE in (PEM)).Selected Column → The specific underlying metric chosen based on the conditions (e.g.,
#TRx_IDN).
This tells you which branch of your dynamic match CASE logic was triggered, helping you verify that the right logic path executed based on query conditions.
When using Kaiya or Search, users can type questions like:
“Show me TRx by district for CE territory”
Tellius will automatically pick the appropriate metric (e.g., TRX_CE_DISTRICT) and log the mapping logic, available via the chart’s options menu.
Example: "Adaptive Sales"
For example, consider a single Sales metric that automatically adapts to the correct calculation:
Country view → use
Sales_CountryRegion view → use
Sales_RegionStore view → use
Sales_StorePremium filter + Country → use
Sales_Country_PremiumPremium only → use
Sales_PremiumEverything else → fall back to base
Sales
Tellius dynamically chooses the correct branch based on the query context, regardless of how users pivot or filter the data.
Best-practices
Start with most specific (e.g.,
Store + Premium) and move toward more general (e.g.,Region).End with a default to avoid null results (
else Sales end).Keep names exact and case-sensitive—Tellius matches column names verbatim.
For live connections, test the heaviest scenario; dynamic logic still queries the source once, but you may want to index frequently used columns.
When both groupings and filters are present, Tellius prioritizes the highest level in your hierarchy for selection.
Quick troubleshooting
If the metric never returns, a referenced column is misspelled or missing in the Business View.
If the run-time is slow, then there are too many nested IN-FILTER checks; consider simplifying or adding indexes.
If the result is unexpected or incorrect, a more general condition captured the query first. The condition order is incorrect; move your specific rule higher.
Use query logs and Search Inspector to verify the branch fired, filters detected, and grouping logic applied.
Works on both row-level and column-level calculations.
Functions in live and in-memory Business Views (performance depends on the source).
Dynamic columns themselves do not appear when building other calculated columns—reference the underlying measures instead.
Limitations
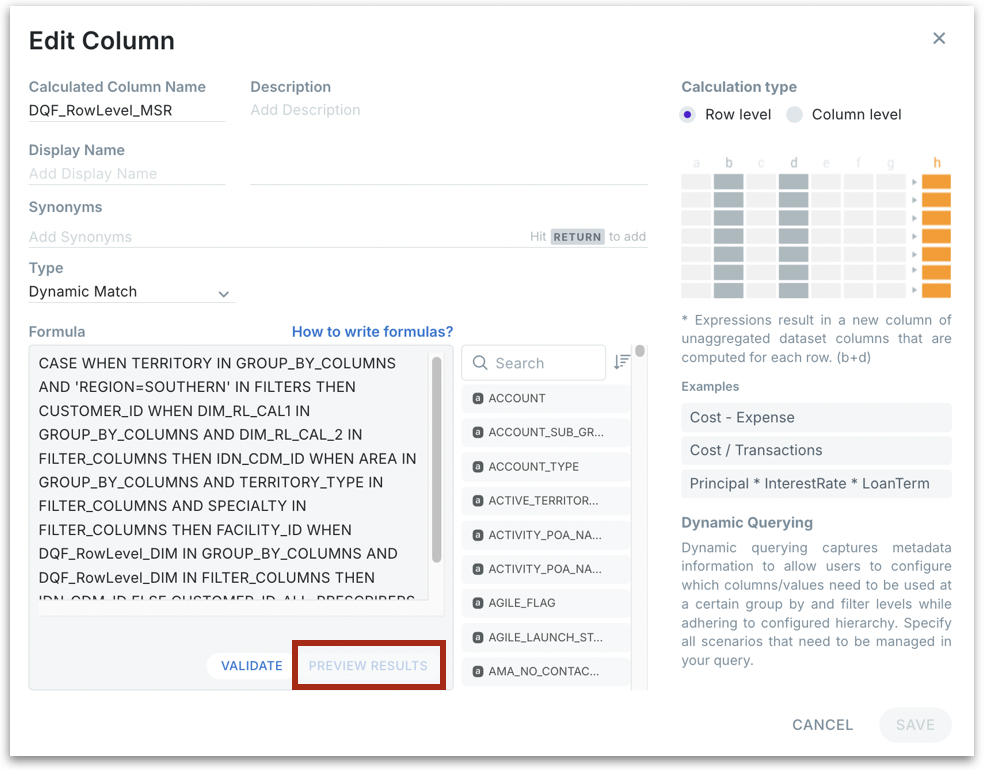
In the calculated column builder, the Preview option is disabled for dynamic match.

Dynamic match logs are available only in Vizpads, Kaiya, Search and currently not available in:
Insights
Feeds
Change Aggregation charts
Market Share target charts
Dynamic columns do not appear when creating other calculated columns. Reference the underlying measures instead.
Was this helpful?