What's New
Release 5.4
Changelog - 5.3.3
Changelog - 5.3.2
Changelog - 5.3.1
Release 5.3
Changelog - 5.2.2
Changelog - 5.2.1
Release 5.2
Changelog - 5.1.3
Changelog - 5.1.2
Changelog - 5.1.1
Release 5.1
Changelog - 5.0.5
Changelog - 5.0.4
Changelog - 5.0.3
Changelog - 5.0.2
Changelog - 5.0.1
Release 5.0
Changelog - 4.3.4
Changelog - 4.3.3
Changelog - 4.3.2
Changelog - 4.3.1
Release 4.3 (Fall 2023)
Changelog - 4.2.7
Changelog - 4.2.6
Changelog - 4.2.5
Changelog - 4.2.4
Changelog - 4.2.3
Changelog - 4.2.1
Changelog - 4.2.2
Release 4.2
Changelog - 4.1.5
Changelog - 4.1.4
Changelog - 4.1.3
Changelog - 4.1.2
Changelog - 4.1.1
Release 4.1
Release 4.0
Release 3.9
Release 3.8
Release 3.7
Release 3.6
Release 3.5
Release 3.4
Release 3.3
Release 3.2
Release 3.1
Release 3.0
Release 2.4.1
Release 2.4
Free Cloud Trial
Release 1.8
Release 2.3
Release 2.2
Release 2.1
Release 2.0
Release 1.7
Release 1.6
Release 1.5
Getting Started
Quick Guide
Best Practices Guide
Search - Best Practices
Vizpads (Explore) - Best Practices
Insights (Discover) - Best Practices
Predict - Best Practices
Data - Best Practices
Glossary
Tellius 101
Navigating around Tellius
System requirements
Tellius Architecture
Installation steps for Tellius
Guided tours for quick onboarding
Customizing Tellius
Search (Natural Language)
Search in Tellius
Guide Me
How to Search
Business View List / Columns
Query
Query
Percentage Queries
Time Period Queries
Live Query
Generating Insights-based queries from Search
Search Result
Discover Insights
Interactions
Chart Operations
Add to Vizpad
Table View
Switch Chart type
Change Chart Config
Apply Filters
Change Formatting
Measure Aggregation - Market Share Change
View Raw Data
Download/ Export
Embed URL
Partial Data for Visualization
Best-fit visual
Add to Vizpad
Adding the chart to a Vizpad
Customize the auto-picked columns
Search Query Inspector
Teach Tellius
History
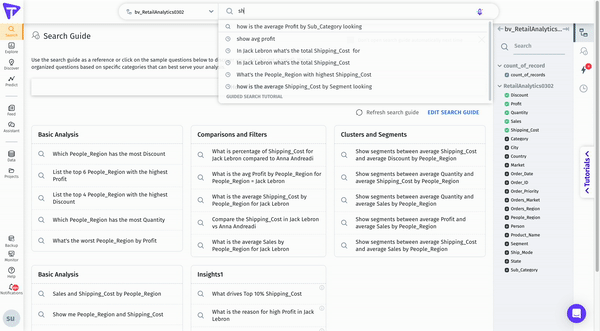
Guided Search
Add Guided Search Experience
Display Names in the Search Guide
Guided Search
Guided Search Syntax and Attributes
Deep Dive
Maps in Search
Search Keywords
Percentage Queries
Time Period Queries
Year-over-Year Analysis
Additional Filters
Pagination
List View In Search Results
Marketshare queries
Embed Search
Personalized Search
Search Cheat Sheet
Filters in Help Tellius Learn
Explore (Vizpads)
Dashboards in Tellius
Vizpad Creation
Create Interactive Content
Create Visualization Charts
List of Charts
Common Chart Types
Line Chart
Bar Chart
Pie Chart
Year-over-Year Functionality in Vizpad
Area Chart
Combo Chart
KPI Target Chart
Treemaps
Bubble Chart
Histogram
Heat-Map Charts
Scatter Chart
Other Charts
Cumulative line chart
Cohort Chart
Explainable AI Charts
For each chart
Create Visualization Charts
Global Filters
Embedded Filters
Other Content
Anomaly management for charts
Creating Interactive Content
Vizpad level Interactions
Viz level Interactions
Discover Insights
Drivers
Discover hidden insights - Genius Insights
How Genius Insights works
Discoveries in Insight
Anomalies on Trend
Interactions
Chart Operations
Switch Chart type
Change Chart Config
Apply Filters
Change Formatting
Add X/Y Axis Target Lines to Scatter Chart
Improvements to Conditional Formatting
Adding Annotations to Tables
Displaying query execution time
Embedding Vizpad
Vizpad Consumption
Collection of Interactive Content
Vizpad level Interactions
Global Filter on the fly
Global Resolutions
Refresh
Notifications / Alerts
Share
Download / Export
Unique name for Vizpads
Edit Column Width
Viz level Interactions
Importing bulk filter values
Multi-Business View Vizpads
Discover (Genius Insights)
Discoveries
What are discoveries
Type of Discoveries in Tellius
Create Discoveries
Kick-off Key Drivers
Edit Insights
Key Driver Insights
Components of Key Drivers
What are Key Drivers
Edit Key Driver Insights
Segment Drivers
Trend Drivers
Trend Insights (Why Insights)
Components of Trend Insights
WHAT: Top Contributors
WHY: Top Reasons
HOW: Top Recommendations
Seamlessly navigating to "Why" from "What"
Create Trend Insight
Edit Trend Insights
What are Trend Insights
Comparison Insights
Components of Comparison Insights
Create Comparison Insight
What are Comparison Insights
Edit Comparison Insights
Others Actions
Save
Refresh
Share Insights
Download
Adding Insights to Vizpad
Insights Enhancements
Embedding Insight
Impact Calculation for Top Contributors
Marketshare
Live Insights
Predict (Machine Learning)
Machine Learning
AutoML
How to create AutoML models
Leaderboard
Prediction
Others
What is AutoML
Point-n-Click Predict
Feed (Track Metrics)
Assistant (Conversations)
Tellius on Mobile devices
Data (Connect, Transform, Model)
Connectors
Connector Setup
Google BigQuery
Google Cloud SQL
Connecting to a PostgreSQL Cloud SQL Instance
Connecting to an MSSQL Cloud SQL Instance
Connecting to a MySQL Cloud SQL Instance
Snowflake
PrivateLink
Snowflake Best Practices
OAuth support for Snowflake
Integrating Snowflake with Azure AD via OAuth
Integrating Snowflake with Okta via OAuth
Edit Connector
Live Connect
Data Import
Cache
Direct Business View
JDBC connector for PrestoDB
Amazon S3
Time-to-Live (TTL) and Caching
Loading Excel sheets
Looker SQL Interface
Databricks
Connecting to an AlloyDB Cluster
List of Connectors by Type
Tables Connections
Custom SQL
Schedule Connector Refresh
Share Connections
Datasets
Load Datasets
Configure Datasets (Measure/Dimensions)
Transform Datasets
Create Business View
Share Datasets
Copy Datasets
Delete Datasets
Swapping datasources
Metadata migration
Data Prep
Datasets
Data Profiling / Statistics
Transformations
Dataset Transform
Aggregate Transforms
Calculated Columns
SQL Transform
Python Transform
Create Hierarchies
Filter Data
SQL Code Snippets
Multiple Datasets Scripting SQL
Column Transforms
Column Metadata
Column type
Feature type
Aggregation
Data type
Special Types
Synonym
Rename Column
Filter Column
Delete Column
Variable Display Names
Other Functions
Metadata View
Dataset Information
Dataset Preview
Alter Pipeline Stage
Edit / Publish Datasets
Data Pipeline (Visual)
Alerts
Partitioning for JDBC Datasets
Export Dataset
Write-back capabilities
Data Fusion
Schedule Refresh
Business Views
Create Business View
Create Business View
Datasets Preview & List
Add datasets to Model
Joins
Column selection
Column configuration
Primary Date
Geo-tagging state/country/city
Save to Fast Query Engine
Publish
Business View
What is Data Model
BV Visual Representation (Preview)
BV Data Sample
Learnings (from Teach Me)
Custom Calculations (Report-level Calc)
Predictions on BV
BV Refresh
Export/ Download Business View
Share Business View
URL in Business View
Request Edit Access
Tellius Engine: Comparison of In-Memory vs. Live Mode
Projects (Organize Content)
Monitor Tellius
Embedding Tellius
Embedding
Settings
About Tellius
User Profile
Admin Settings
Manage Users
Team (Users)
Details & Role
Create a new user
Edit user details
Assigning the user data to another user
Restricting the dataset for a user
Deleting a user
Assign User Objects
User roles and permissions
Teammates (Groups)
Authentication & Authorization
Authentication
Authorization (Roles)
API Access (OAuth Access)
Audit Logs
Application & Advanced Settings
Data
Machine Learning
Genius Insights
Usage tracking & Support
CDN
Download Business View, Dataset, and Insights for Live BV
Customize Help
Impersonate
Data Size Estimation and Calculation
Miscellaneous Application Settings
Configuration for time/date-related results
Dataflow Access
Enable In-memory operations on Live sources
Language Support
Administration
Setup & Configuration
Installation Guide
AWS Marketplace
Autoscaling
Backup and Restore
Help & Support
FAQ
Data Preparation FAQs
Environment FAQs
Search FAQs
Vizpads FAQs
Data Caching
Security FAQs
Embedding FAQs
Insights FAQs
Tellius Product Roadmap
Help and Support System
Guided Tours
Product Videos
Articles & Docs
Provide Feedback
Connect with Tellius team
Support Process
Notifications
Tellius Kaiya
Say hello to Tellius Kaiya 👋
Automating the generation and validation of SQL/Python code
Kaiya Learnings
Ask metadata-related questions to Kaiya
Automating the generation of metadata
Kaiya conversational AI
Kaiya mode in Search
Chart and tab summaries
Getting Started Videos
Getting Started
Tellius Connect
Tellius Data Overview Video
Connecting to Flat Files Video
Connecting to Data Sources Video
Live Connections Video
Data Refresh and Scheduling Video
Tellius Prep
Getting Started with Tellius Prep Video
Transformations, Indicators, Signatures, Aggregations and Filters Video
SQL and Python Video
Working with Dates Video
Data Fusion Video
Business View Video
Business Mapping Video
Report Level Calculations Video
Writeback to DB
Natural Language Search
Getting Started with Search Video
How-To Search Video
Customizing Search Results Video
Search Interactions Video
Help Tellius Learn
Explore - Vizpads
Getting Started with Vizpads Video
Creating Vizpads Video
Creating and Configuring Visualizations Video
Viz-Level Interactions Video
Vizpad-Level Interactions Video
Auto Insights
Getting Started with Auto Insights Video
Discovery Insights Video
Segment Insights Video
Trend Insights Video
Comparison Insights Video
Iterate on Insights Video
Tellius Feed Video
Predict - ML Modeling
Getting Started with Predict Video
AutoML Configuration Video
AutoML Leaderboard Video
Point-n-Click Regression Video
Point-n-Click Classification Video
Point-n-Click Clustering Video
Point-n-Click PythonML Video
PredictAPI Video
Apply ML Model Video
ML Refresh and Schedule Video
Admin
Best Practices & FAQs
API Documentation
Vizpad APIs
User & user groups APIs
Machine Learning APIs
Fall 2023 (4.3)
Table of Contents
- All Categories
- Search (Natural Language)
- Deep Dive
- Marketshare queries
Marketshare queries

Marketshare is a performance metric used to measure a company's sales or market share relative to the total sales or performance of a specific market or industry. The following documentation includes syntax and examples that will help you understand how to accurately calculate marketshare and get valuable insights into your company's performance.
Syntax
Marketshare KPI for target variable for/by filters/dimensions
- Green-colored text represents the KPI (key performance indicator) that you want to measure, such as TRx or NRx. It is always the word that follows “Marketshare”.
- Red-colored text is the target variable or marketshare filter (i.e., filter in numerator which will not be present in the denominator). This is the text that follows the KPI; unless there is a "vs" or "compared to" keyword, in which case it would be the first two words.
- Blue-colored text is the list of global filters (the parameters you want to apply in your marketshare analysis). There could be multiple filters after a "for" or "in”.
Examples
Marketshare dollar sales for Brand A in 2019
$$\frac{\text{Dollar sales for Brand A in 2019}}{\text{Total dollar sales in 2019}}$$
Marketshare dollar sales for Brand A vs Brand B for New York for Derm
is the same as
Marketshare dollar sales for Brand A compared to Brand B for Derm for New York
$$\frac{\text{Dollar sales for Brand A in New York}}{\text{Total dollar sales in New York}}\ =\ \frac{\text{Dollar sales for Brand B in New York}}{\text{Total dollar sales in New York}}$$
Marketshare dollar sales for brand by state
This shows the multiple values for each brand for a particular state, where the different brands would sum upto 100%
$$\frac{\text{Dollar sales for a particular brand for state}}{\text{Total dollar sales for state}}$$
Marketshare dollar sales for state by brand
This shows the multiple values for each brand with the shares of state among other tiers (where the different brands would not sum upto 100%)
$$\frac{\text{Dollar sales for state for a particular brand}}{\text{Total dollar sales for the brand}}$$
Marketshare dollar sales for Brand X by segment
This shows the share of sales Brand X has within each segment (which does not add up to 100%)
$$\frac{\text{Dollar sales for Brand X in a particular segment}}{\text{Total dollar sales for a particular segment}}$$
Marketshare dollar sales for/by segment for Brand X
This shows the share of each segment's sales for Brand X (same as the percentage of dollar sales in XYZ, and adds up to 100%)
$$\frac{\text{Dollar sales for Brand X in a particular segment}}{\text{Total dollar sales for Brand X}}$$
Marketshare dollar sales for Brand X in 2021 compared to 2022
$$\frac{\text{Dollar sales for Brand A in 2021}}{\text{Total dollar sales in 2021}}\ =\ \frac{\text{Dollar sales for Brand A in 2022}}{\text{Total dollar sales in 2022}}$$
Change in marketshare
"Change in market share" refers to the variation in the percentage of a company's sales (or another relevant measure) within a specific market or industry over a given time period. This change can be due to factors such as new product launches, pricing strategies, marketing efforts, or changes in consumer behavior. Understanding the "change in market share" helps businesses evaluate the effectiveness of their strategies, monitor competition, and identify market trends.
Now, from 4.2 version, users can now include "change in market share" keyword for marketshare-related queries. With this out-of-the-box support for "change in market share" keyword, users can now better analyze changes in market share over time or across different conditions, empowering their decision-making process.
It's important to understand that the placement of the target variable in the query can significantly affect the resulting data. For instance, the two queries below provide different outputs due to the change in position of 'Advil', the target variable:
market share of dollar sales for Advil by segmentmarket share of dollar sales by segment for Advil
When adding a filter for the target variable and breaking it down by another filter, a new type of query arises. For example, market share of dollar sales for Advil for adult internals for retailers . To compare these results over different time periods, such as the "last 4 weeks vs the same period a year ago", we've introduced support for "change in market share" keyword queries.
Syntax for change in market share
To utilize this feature, ensure you provide the following values in the query where the target variable appears after the measure column. The syntaxes are,
- Standard Syntax: Show me [change/percentage change/percent change] in market share <M1> for <V1> for <F1> [vs/ compared to] <F2>
- Syntax with Global Filters: Show me [change/percentage change/percent change] in market share <M1> for <V1> for <F1> [vs/ compared to] <F2> for X1 for X2
Here,
- M1 represents the measure
- V1 represents the target variables
- F1 and F2 represent a list of filters for the target population, with multiple filters following "for" or "in"
- X1 and X2 represent a list of global filters, including dimension or date columns
Users can now execute queries such as:
- Show me [change/percentage change/percent change] in market share Sales for Nike for New York vs California
- Show me [change/percentage change/percent change] in market share Sales for GoPro for North America vs South America for 2022
- Show me [change/percentage change/percent change] in market share Sales for Nike for New York vs California for 2022 for First-class shipping
Syntax and examples of queries that can be executed
Here <filter 1> and <filter 2> represent dimensions or time periods
Syntax 1: Show me change/percentage change in marketshare <measure> by <dimension> for/in <filter 1> compared to/vs. <filter 2>
Example 1: Show me change/percentage change in marketshare sales by category for/in California compared to/vs. Washington
Syntax 2: Show me change/percentage change in marketshare <measure> by <dimension> for/in <filter 1> compared to/vs. <filter 2>
Example 2: Show me change/percentage change in marketshare sales by category for/in 2013 compared to 2014
Syntax 3: Show me change/percentage change in marketshare <measure> for/in <filter 1> compared to/vs. <filter 2>
Example 3: Show me change/percentage change in marketshare sales for/in California compared to/vs. Washington